

Sound investments
don't happen alone
Find your crew, build teams, compete in VS MODE, and identify investment trends in our evergrowing investment ecosystem. You aren't on an island anymore, and our community is here to help you make informed decisions in a complex world.


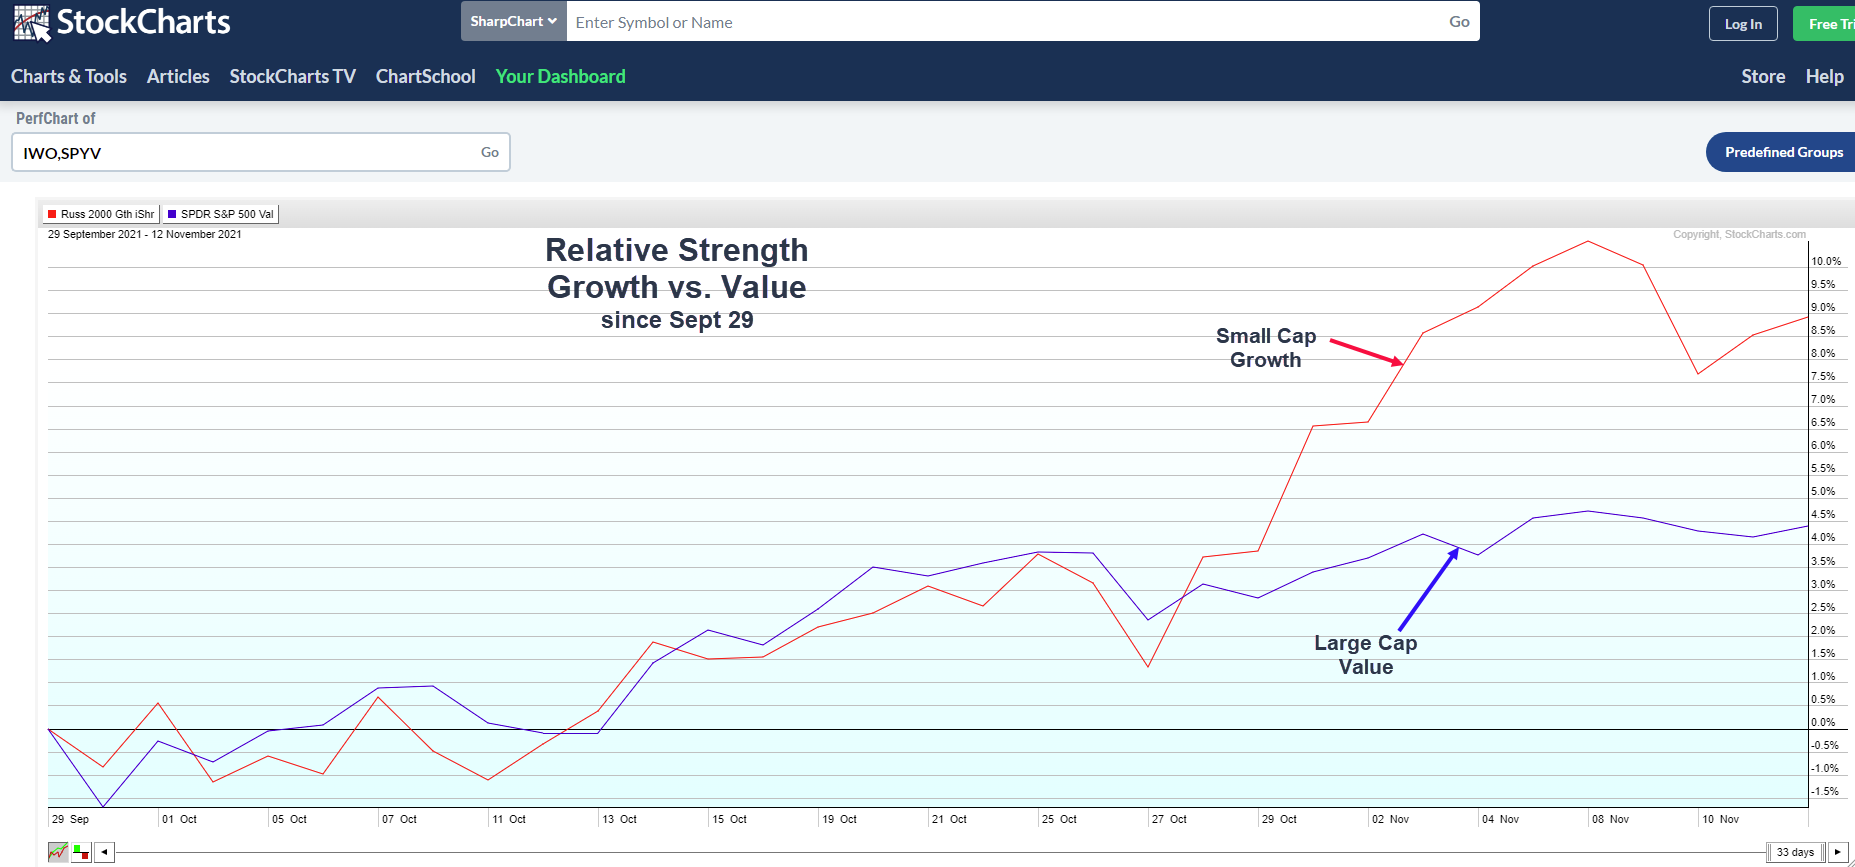


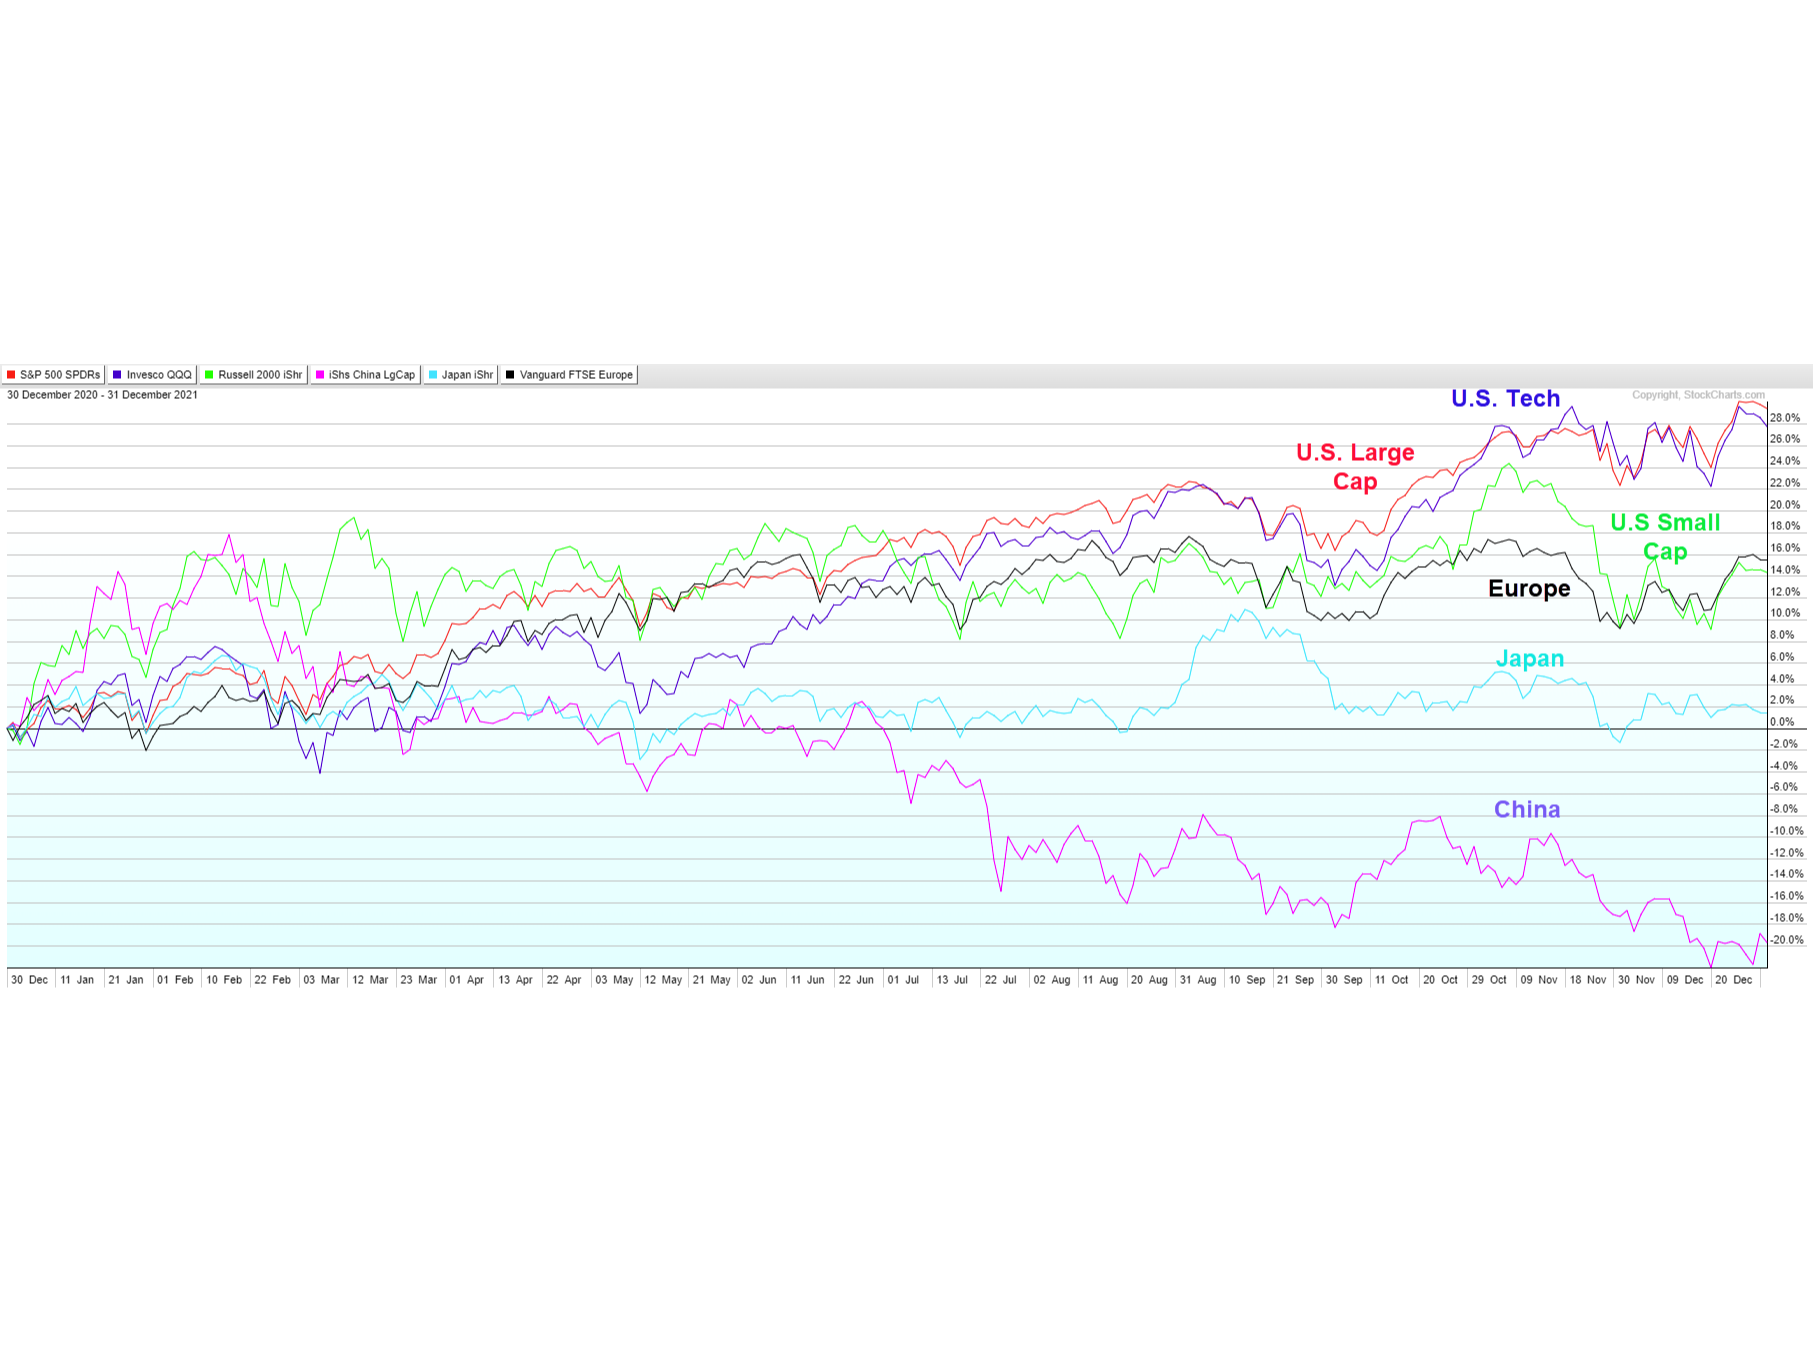
The chart is a relative strength chart of key international indexes for 2021. (all start at the same 0% point on December 31, 2020; chart courtesy of StockCharts.com, used with permission)
Now for all of those trading Crypto I decided not to put that on the chart (i.e. ETF GBTC). The reason is that it was EXTREMELY volatile. Case in point: starting 12/31/20 at 0%, at peak for the year of +77% on 2/19/21, then -25% for the year on 7/20/21, then back up to +67% for the year on 11/9/21, before finishing at +7% for the entire year overall. I dare say that the daily volatility in between was exceptional too. If one trades crypto, one must be exceptionally nimble and have a plan. (i.e. sure sounds like “day trading” to me . . . . not my style at all) About the only thing that I can say is that 2022 will likely not be the same as 2021. I am expecting more volatility in the stock market. Wishing you success in 2022. …….. Tom …….
more discussion at: www.special-risk.net