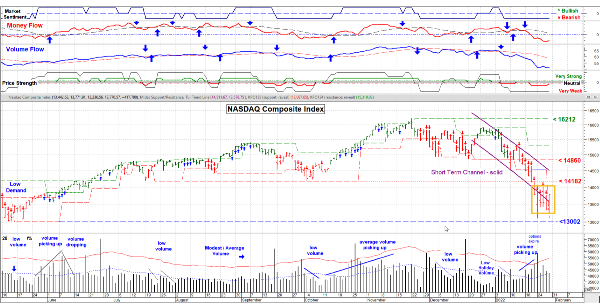
Jan 28, 2022 - From the height of these daily bars last week we sure can see volatility, but we’re still in a “bit of a Box”, that is, a trading range / consolidation pattern. Until we break out decisively no one is very certain about the next trend or the direction. There is a case to be made for both.
The chart remains Bearish and we’ve come down a fair amount and quickly: 42% of the NASDAQ Composite stocks have been cut in half, 70% of Healthcare stocks have been cut in half and 30% of all stocks are at 52 week lows. Sounds terrible right? Well . . . this can be a good place for a turn around with a quick up trend . . . it’s happened before and it’s not unusual. Add to that support near the preverbal 200 day moving average too. Could be a good launching pad for a move back up.
On the other side (Bearish), the yield curve on the 2 year and 10 year Treasury bonds has flattened (i.e the interest rate of the 2 Yr. increase more than the 10 Yr. last week). Not a positive sign. Add to that the Ukrainian situation, inflation and of course, Covid and there is way too much uncertainty out there. And Wall Street does NOT like uncertainty (or things they can’t get inside information on).
So for the time being we’re in a box. I’m looking for a break above 14182 to be more bullish or a break below 13002 to be Bearish. BTW, the 13002 level on the NASDAQ goes way back to May 12, 2021. Yeah . . . I know. Oh yes, I also note that volume is shallow, so it looks like a lot of waiting right now, few are willing to stick their necks out.
More discussion at: www.special-risk.net * Chart by MetaStock, used with permission.*
I/we have no positions in any asset mentioned, but may initiate a position over the next 7 days


Jan 28, 2022 - From the height of these daily bars last week we sure can see volatility, but we’re still in a “bit of a Box”, that is, a trading range / consolidation pattern. Until we break out decisively no one is very certain about the next trend or the direction. There is a case to be made for both.
The chart remains Bearish and we’ve come down a fair amount and quickly: 42% of the NASDAQ Composite stocks have been cut in half, 70% of Healthcare stocks have been cut in half and 30% of all stocks are at 52 week lows. Sounds terrible right? Well . . . this can be a good place for a turn around with a quick up trend . . . it’s happened before and it’s not unusual. Add to that support near the preverbal 200 day moving average too. Could be a good launching pad for a move back up.
On the other side (Bearish), the yield curve on the 2 year and 10 year Treasury bonds has flattened (i.e the interest rate of the 2 Yr. increase more than the 10 Yr. last week). Not a positive sign. Add to that the Ukrainian situation, inflation and of course, Covid and there is way too much uncertainty out there. And Wall Street does NOT like uncertainty (or things they can’t get inside information on).
So for the time being we’re in a box. I’m looking for a break above 14182 to be more bullish or a break below 13002 to be Bearish. BTW, the 13002 level on the NASDAQ goes way back to May 12, 2021. Yeah . . . I know. Oh yes, I also note that volume is shallow, so it looks like a lot of waiting right now, few are willing to stick their necks out. More discussion at: www.special-risk.net * Chart by MetaStock, used with permission.*
I/we have no positions in any asset mentioned, but may initiate a position over the next 7 days