Investing in mutual funds and ETFs is a fundamental part of long-term investing. Many retirement plans contain mutual funds, and investors often select exchange traded funds (ETFs) for their taxable account. In either case, investors should focus on diversified, low-cost investments for their portfolio. Two of the largest ETFs by assets under management (AUM) are the Vanguard S&P 500 ETF (VOO) and Invesco QQQ Trust ETF (QQQ). This article will compare VOO vs. QQQ as two possible core holdings for a ETF portfolio.
VOO and QQQ track different indices, the popular S&P 500 Index and Nasdaq-100, respectively. But they have some overlap, and both are extremely popular. However, they have different parent fund managers, Vanguard and Invesco. Because of these variations, it may be challenging to determine which fund is a better investment. So, we compare these two popular ETFs to help you decide.

VOO vs. QQQ: Which ETF is a Better Choice for the Long-Term?
Affiliate
StockRover is one of the best stock, ETF, and mutual fund screeners and analysis tools. It has 8,500+ stocks, 4,000 ETFs, and 40,000 mutual funds. You can get access up to 650+ metrics and financial data. The award winning Stock Rover platform includes watchlists, portfolio integration, portfolio rebalancing, e-mail and text alerts, future income forecasts, etc.
Vanguard S&P 500 ETF (VOO)
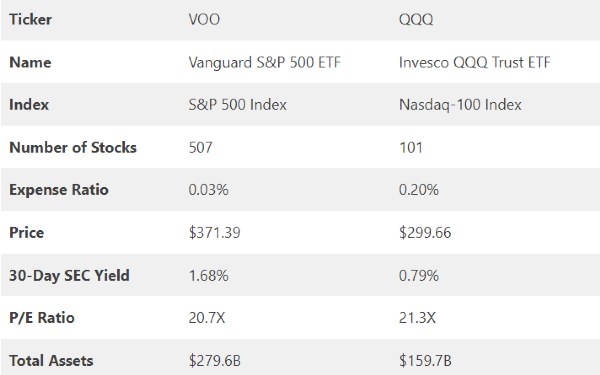
The Vanguard S&P 500 ETF (VOO) is managed by Vanguard, the asset manager founded by John Bogle. It is known for its wide array of inexpensive index funds and ETFs. The ETF aims to track the performance of the S&P 500 Index, which contains the 500 largest U.S. companies. The fund has 507 holdings, slightly higher than the 503 stocks in the benchmark.
The VOO fund’s inception date was September 7, 2010. It has a rock-bottom expense ratio of 0.03%, costing $3 for every $10,000 invested. As many know, low costs are a crucial advantage for total returns over time. High expense ratios subtract significantly from performance.
However, the 30-day SEC yield is only 1.68% because some stocks have low dividend yields or do not pay a dividend at all. For example, Amazon does not pay dividends and is the number three holding. Similarly, Google, Berkshire Hathaway, and Tesla do not pay dividends.
Portfolio Composition
Total AUM is $792.6 billion, with $279.6 billion in the share class, making the fund one of the five largest ETFs. In addition, because the ETF tracks the S&P 500 Index, it owns many large-cap stocks, like Apple (AAPL), Microsoft (MSFT), Amazon.com (AMZN), Exxon Mobil (XOM), etc., giving it a growth tilt. Hence, VOO’s share price increases when these large-cap stocks do well, especially companies in the Information Technology sector.
The VOO ETF has more than a quarter of its assets in the Information Technology sector. Health Care follows this at 14.7%, Financials at 11.7%, and Consumer Discretionary at 10.6%. The four combined sectors comprise nearly two-thirds of the assets at approximately 63.5%.
The top 10 holdings of VOO:
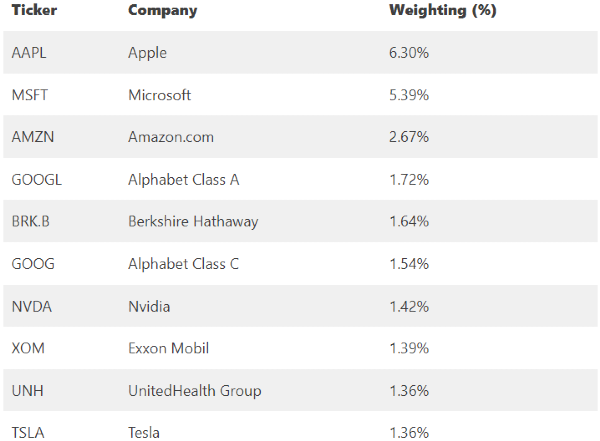
Source: Vanguard website (as of January 31, 2023)
The top 10 holdings make up about 24.79% of the fund.
Invesco QQQ Trust ETF (QQQ)
QQQ is the Invesco QQQ Trust ETF. Invesco, a large asset manager, manages and brings the fund to investors. The ETF tracks the Nasdaq-100 Index, the 100 largest domestic and international companies listed on the Nasdaq Exchange. The fund has 101 holdings.
The QQQ fund is over twenty years old and started on March 10, 1999. The expense ratio is higher than VOO at 0.20%. Investors will pay $20 for every $10,000 invested. Although QQQ is pricier than VOO, the cost is not unreasonable. The 30-day SEC yield is 0.79%, a low value. But investors should expect this because many stocks held by the ETF do not pay a dividend or pay a low one.
Portfolio Composition
The total AUM is $159.71 billion, making the fund the fifth-largest ETF. Because the ETF tracks the Nasdaq-100 Index, it owns many large-cap tech and growth stocks. Primary holdings are Microsoft, Apple, Alphabet, Nvidia, Meta, etc. Consequently, the QQQ ETF has a strong growth tilt and will do well when tech stocks rise but decline when they drop.
The QQQ ETF is highly concentrated, with roughly 50% of AUM in the Information Technology sector. Communication Services follow this at 16.05% and Consumer Discretionary at 14.28%. The three sectors combined makeup slightly more than 80% of the assets.
The top 10 holdings of QQQ:
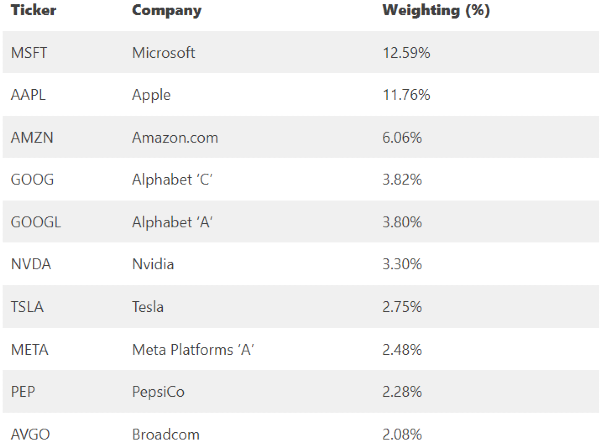
Source: Vanguard website (as of December 31, 2022)
The top 10 holdings make up about 50.92% of the fund.
Similarities: VOO vs. QQQ
Because both funds have a growth tilt, they overlap in the top three sectors and top 10 stocks. Both are solid ETFs to own, depending on your investing goal.
- Passively managed ETFs.
- Focus on growth and Information Technology.
- Similar top three sectors.
- Similar top 10 stocks.
Even though they have similarities, the differences between VOO vs. QQQ are worth discussing. It will help you decide which one to add to your portfolio.
Differences: VOO vs. QQQ
Checking the differences, a few apparent ones are:
- VOO is issued by Vanguard, while Invesco issues QQQ.
- The expense ratio of VOO is 0.03%, and QQQ is 0.20%.
- VOO has 507 holdings, while QQQ has 101 holdings.
- VOO has $279.6 billion in assets. QQQ has $159.7 billion in assets.
- VOO has a yield of 1.68%, and QQQ has a yield of 0.79%.
Besides the above differences, the funds perform differently and track different benchmarks. Further, VOO is better at keeping costs down with a higher dividend yield vs. QQQ. But neither are dividend ETFs.
Parent Firm
Regarding VOO vs. QQQ from a parent firm standpoint, both are large and diversified. VOO is issued by Vanguard, the largest mutual fund, and the second-largest ETF asset manager globally. They are also the second-largest issuer of ETFs. Vanguard has over $8 trillion in total AUM.
QQQ is issued by Invesco, another well-known mutual fund and ETF asset manager. But the firm is smaller than Vanguard, with about $1.4 trillion in total AUM.
Benchmark Index Comparison
When it comes to comparing VOO vs. QQQ, the benchmarks differ. As discussed above, VOO seeks to track the S&P 500 Index. The S&P 500 Index consists of the 500 leading publicly traded U.S. companies. Market capitalization is the primary qualifying factor for a company’s inclusion in the S&P 500 Index fund, but it is not the only one.
QQQ’s benchmark is the Nasdaq-100 Index. It includes the 100 largest domestic and international non-financial companies based on market capitalization listed on the Nasdaq Exchange.
Expense Ratios
Expense ratios matter in long-term ETF performance. A minimal difference can add up to a large amount over a decade or two of investing in a fund.
Passively or actively managed funds have expenses. These expenses could be salaries to pay analysts or portfolio managers, management fees, office space rent, and many others. Funds will pass these expenses to the investor as the expense ratio.
When comparing VOO vs. QQQ, there is a significant difference in their expense ratios. While VOO has a minimal 0.03% ratio, QQQ has a six times greater ratio of 0.20%. This difference will add up over time. Moreover, QQQ’s higher expense ratio will subtract from total performance.
Portfolio Composition Differences
Besides the top ten stocks, the overall portfolio composition differs between VOO vs. QQQ. But, both VOO and QQQ emphasize the same top three sectors but with varying weightings.
The VOO ETF is more diversified and includes all 11 sectors. On the other hand, the QQQ ETF excludes the Basic Materials, Real Estate, Utilities, and Financials sectors. Also, it barely owns the Utilities and Energy sectors. Hence, QQQ is not an all-in-one fund because of its limited diversification.
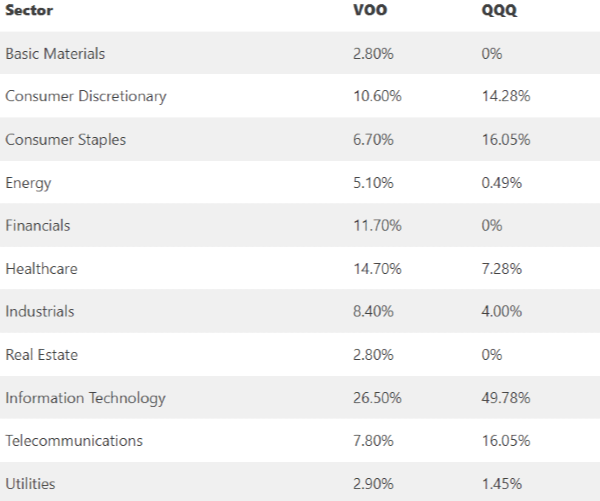
Source: Vanguard and Invesco websites (as of January 31, 2023, and December 31, 2022)
Overall Performance
Many investors look to performance first. However, that could be a mistake because past performance does not indicate future performance. Both funds have minor tracking errors relative to their respective benchmarks.
The VOO ETF has a 5-year annualized return of 9.77% and a cumulative total return of 59.38%. It has a 10-year annualized return of 12.21% and a cumulative total return of 216.35%. Since its inception in 2010, the annualized return has been 13.03%, and the cumulative total return was 362.83%.
The QQQ ETF has a 5-year annualized return of 12.53% and a cumulative total return of 87.14%. It has a 10-year annualized return of 17.06% and a cumulative total return of 388.10%. Since its inception in 1999, the annualized return has been 8.29%.
Even though they have similar top three sectors and overlapping stock holdings, QQQ’s annualized returns over the past 5 and 10 years have been greater. This is because the Nasdaq-100 contains more tech and high-growth stocks; thus, returns tend to be stronger. In addition, tech stocks had a strong bull market until the end of 2021.
However, QQQ has performed worse since its inception because it existed during the dot-com bubble crash and the subprime mortgage crisis. Two events that caused tech stocks to plummet.
VOO vs. QQQ: Which is a Better Choice?
When making any investment, it comes down to your comfort level. In comparing VOO vs. QQQ, they are different but with a few similarities. QQQ will perform better when tech, growth, and the Nasdaq do well. But VOO has done better since its inception, mainly because it is newer and avoided the dot-com crash and subprime mortgage declines.
VOO has a much lower expense ratio for investors desiring to avoid high costs. Hence, QQQ needs to continue outperforming VOO to compensate for this difference.
VOO also holds more stocks, making it more diversified across sectors. It also probably makes it less volatile, a plus during bear markets.
Both ETFs are solid and have withstood the test of time. VOO can be a core holding for portfolios because of its lower cost and diversification. That said, QQQ is popular with some investors. Both ETFs have strengths and weaknesses, and each person must determine which fits their investment style and goals better.


Investing in mutual funds and ETFs is a fundamental part of long-term investing. Many retirement plans contain mutual funds, and investors often select exchange traded funds (ETFs) for their taxable account. In either case, investors should focus on diversified, low-cost investments for their portfolio. Two of the largest ETFs by assets under management (AUM) are the Vanguard S&P 500 ETF (VOO) and Invesco QQQ Trust ETF (QQQ). This article will compare VOO vs. QQQ as two possible core holdings for a ETF portfolio.
VOO and QQQ track different indices, the popular S&P 500 Index and Nasdaq-100, respectively. But they have some overlap, and both are extremely popular. However, they have different parent fund managers, Vanguard and Invesco. Because of these variations, it may be challenging to determine which fund is a better investment. So, we compare these two popular ETFs to help you decide.
VOO vs. QQQ: Which ETF is a Better Choice for the Long-Term?
Affiliate
Vanguard S&P 500 ETF (VOO)
The Vanguard S&P 500 ETF (VOO) is managed by Vanguard, the asset manager founded by John Bogle. It is known for its wide array of inexpensive index funds and ETFs. The ETF aims to track the performance of the S&P 500 Index, which contains the 500 largest U.S. companies. The fund has 507 holdings, slightly higher than the 503 stocks in the benchmark.
The VOO fund’s inception date was September 7, 2010. It has a rock-bottom expense ratio of 0.03%, costing $3 for every $10,000 invested. As many know, low costs are a crucial advantage for total returns over time. High expense ratios subtract significantly from performance.
However, the 30-day SEC yield is only 1.68% because some stocks have low dividend yields or do not pay a dividend at all. For example, Amazon does not pay dividends and is the number three holding. Similarly, Google, Berkshire Hathaway, and Tesla do not pay dividends.
Portfolio Composition
Total AUM is $792.6 billion, with $279.6 billion in the share class, making the fund one of the five largest ETFs. In addition, because the ETF tracks the S&P 500 Index, it owns many large-cap stocks, like Apple (AAPL), Microsoft (MSFT), Amazon.com (AMZN), Exxon Mobil (XOM), etc., giving it a growth tilt. Hence, VOO’s share price increases when these large-cap stocks do well, especially companies in the Information Technology sector.
The VOO ETF has more than a quarter of its assets in the Information Technology sector. Health Care follows this at 14.7%, Financials at 11.7%, and Consumer Discretionary at 10.6%. The four combined sectors comprise nearly two-thirds of the assets at approximately 63.5%.
The top 10 holdings of VOO:
Source: Vanguard website (as of January 31, 2023)
The top 10 holdings make up about 24.79% of the fund.
Invesco QQQ Trust ETF (QQQ)
QQQ is the Invesco QQQ Trust ETF. Invesco, a large asset manager, manages and brings the fund to investors. The ETF tracks the Nasdaq-100 Index, the 100 largest domestic and international companies listed on the Nasdaq Exchange. The fund has 101 holdings.
The QQQ fund is over twenty years old and started on March 10, 1999. The expense ratio is higher than VOO at 0.20%. Investors will pay $20 for every $10,000 invested. Although QQQ is pricier than VOO, the cost is not unreasonable. The 30-day SEC yield is 0.79%, a low value. But investors should expect this because many stocks held by the ETF do not pay a dividend or pay a low one.
Portfolio Composition
The total AUM is $159.71 billion, making the fund the fifth-largest ETF. Because the ETF tracks the Nasdaq-100 Index, it owns many large-cap tech and growth stocks. Primary holdings are Microsoft, Apple, Alphabet, Nvidia, Meta, etc. Consequently, the QQQ ETF has a strong growth tilt and will do well when tech stocks rise but decline when they drop.
The QQQ ETF is highly concentrated, with roughly 50% of AUM in the Information Technology sector. Communication Services follow this at 16.05% and Consumer Discretionary at 14.28%. The three sectors combined makeup slightly more than 80% of the assets.
The top 10 holdings of QQQ:
Source: Vanguard website (as of December 31, 2022)
The top 10 holdings make up about 50.92% of the fund.
Similarities: VOO vs. QQQ
Because both funds have a growth tilt, they overlap in the top three sectors and top 10 stocks. Both are solid ETFs to own, depending on your investing goal.
Even though they have similarities, the differences between VOO vs. QQQ are worth discussing. It will help you decide which one to add to your portfolio.
Differences: VOO vs. QQQ
Checking the differences, a few apparent ones are:
Besides the above differences, the funds perform differently and track different benchmarks. Further, VOO is better at keeping costs down with a higher dividend yield vs. QQQ. But neither are dividend ETFs.
Parent Firm
Regarding VOO vs. QQQ from a parent firm standpoint, both are large and diversified. VOO is issued by Vanguard, the largest mutual fund, and the second-largest ETF asset manager globally. They are also the second-largest issuer of ETFs. Vanguard has over $8 trillion in total AUM.
QQQ is issued by Invesco, another well-known mutual fund and ETF asset manager. But the firm is smaller than Vanguard, with about $1.4 trillion in total AUM.
Benchmark Index Comparison
When it comes to comparing VOO vs. QQQ, the benchmarks differ. As discussed above, VOO seeks to track the S&P 500 Index. The S&P 500 Index consists of the 500 leading publicly traded U.S. companies. Market capitalization is the primary qualifying factor for a company’s inclusion in the S&P 500 Index fund, but it is not the only one.
QQQ’s benchmark is the Nasdaq-100 Index. It includes the 100 largest domestic and international non-financial companies based on market capitalization listed on the Nasdaq Exchange.
Expense Ratios
Expense ratios matter in long-term ETF performance. A minimal difference can add up to a large amount over a decade or two of investing in a fund.
Passively or actively managed funds have expenses. These expenses could be salaries to pay analysts or portfolio managers, management fees, office space rent, and many others. Funds will pass these expenses to the investor as the expense ratio.
When comparing VOO vs. QQQ, there is a significant difference in their expense ratios. While VOO has a minimal 0.03% ratio, QQQ has a six times greater ratio of 0.20%. This difference will add up over time. Moreover, QQQ’s higher expense ratio will subtract from total performance.
Portfolio Composition Differences
Besides the top ten stocks, the overall portfolio composition differs between VOO vs. QQQ. But, both VOO and QQQ emphasize the same top three sectors but with varying weightings.
The VOO ETF is more diversified and includes all 11 sectors. On the other hand, the QQQ ETF excludes the Basic Materials, Real Estate, Utilities, and Financials sectors. Also, it barely owns the Utilities and Energy sectors. Hence, QQQ is not an all-in-one fund because of its limited diversification.
Source: Vanguard and Invesco websites (as of January 31, 2023, and December 31, 2022)
Overall Performance
Many investors look to performance first. However, that could be a mistake because past performance does not indicate future performance. Both funds have minor tracking errors relative to their respective benchmarks.
The VOO ETF has a 5-year annualized return of 9.77% and a cumulative total return of 59.38%. It has a 10-year annualized return of 12.21% and a cumulative total return of 216.35%. Since its inception in 2010, the annualized return has been 13.03%, and the cumulative total return was 362.83%.
The QQQ ETF has a 5-year annualized return of 12.53% and a cumulative total return of 87.14%. It has a 10-year annualized return of 17.06% and a cumulative total return of 388.10%. Since its inception in 1999, the annualized return has been 8.29%.
Even though they have similar top three sectors and overlapping stock holdings, QQQ’s annualized returns over the past 5 and 10 years have been greater. This is because the Nasdaq-100 contains more tech and high-growth stocks; thus, returns tend to be stronger. In addition, tech stocks had a strong bull market until the end of 2021.
However, QQQ has performed worse since its inception because it existed during the dot-com bubble crash and the subprime mortgage crisis. Two events that caused tech stocks to plummet.
VOO vs. QQQ: Which is a Better Choice?
When making any investment, it comes down to your comfort level. In comparing VOO vs. QQQ, they are different but with a few similarities. QQQ will perform better when tech, growth, and the Nasdaq do well. But VOO has done better since its inception, mainly because it is newer and avoided the dot-com crash and subprime mortgage declines.
VOO has a much lower expense ratio for investors desiring to avoid high costs. Hence, QQQ needs to continue outperforming VOO to compensate for this difference.
VOO also holds more stocks, making it more diversified across sectors. It also probably makes it less volatile, a plus during bear markets.
Both ETFs are solid and have withstood the test of time. VOO can be a core holding for portfolios because of its lower cost and diversification. That said, QQQ is popular with some investors. Both ETFs have strengths and weaknesses, and each person must determine which fits their investment style and goals better.
Originally Posted on dividendpower.org