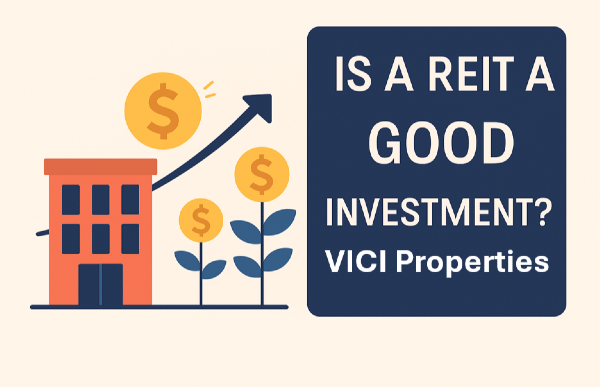
The first real estate fund we’re diving into is VICI REIT. And yes, I’ve got this one in my own portfolio, so I’m not just talking—I’m walking the walk. It ranks number two among top retail-focused real estate funds. Think apartments, shopping centers, and long-term leases. REIT is built for the long haul, and while my personal return hasn’t been stellar—less than 1% since my entry point—it’s still worth a closer look.
Trust and Allocation Matter
The market value of my REIT holding is lower than that of VICI Properties, and that’s not random. It’s about trust. When you trust a stock more, you allocate more. Less confidence? You still might invest, but you’ll scale it down. That’s how allocation works. REIT has earned a five-star rating from Morningstar, which is a solid endorsement. But let’s unpack what that really means.
Morningstar’s five-star rating doesn’t imply REIT has an economic moat. In plain terms, it doesn’t have a strong competitive advantage. Still, the estimated intrinsic value is $49, which is above the current share price. That’s something to keep in mind.
Dividend Strength and Analyst Sentiment
REIT pays out a dividend between 5% and 6%. That’s high. If you get price appreciation on top of that, your total return could be impressive. I expected a bit more from the price side, but the dividend keeps flowing, and that’s a win.
Wall Street analysts aren’t overly enthusiastic. The price target is $44, which is below the intrinsic value. So there’s a bit of a disconnect there. Let’s look at some key metrics to see what’s really going on.
REIT Snapshot
| Metric |
Value |
| Morningstar Rating |
5 Stars |
| Intrinsic Value Estimate |
$49 |
| Current Price Target |
$44 |
| Dividend Yield |
5–6% |
| Personal Return |
<1% |
Price to AFO and Return Potential
REIT’s price-to-AFO (Adjusted Funds from Operations) is around 15. That’s the metric we use instead of earnings for real estate funds. Even on a shorter time frame, the numbers hold up. What does that mean? Based on price-to-AFO, you could potentially earn a 14% annual return.
Next year’s price-to-AFO is estimated at 12.75, which is even more attractive. The five-year average sits around 15, so we’re looking at a favorable entry point. That could translate to a total return of 40% over the next 2.5 years. Not bad if you’re aiming for lower-risk investments.
Price-to-AFO Analysis
| Year |
Price-to-AFO |
Estimated Return |
| Current |
15 |
14% annually |
| Next Year |
12.75 |
Higher potential |
| 5-Year Avg |
15 |
Benchmark level |
Valuation and Sector Comparison
REIT scores a strong buy on factor analysis. That’s a tool I value highly. But don’t skip the fundamentals—business strategy, future growth, management. Still, when we compare REIT to the sector median, the numbers look good.
Next year’s price estimate is 12.7 to 12.5, which is about 14% lower than the sector median. That’s a discount. Growth metrics are also slightly above the sector median. So you’ve got lower valuation and better growth. That’s a plus.
Profitability is another win. REIT’s return on total assets and capital are both above the sector median. Green indicators across the board. So yes, lower price tag, better profit, better growth. That’s why it ranks number two in the sector.
Sector Comparison
| Metric |
REIT Value |
Sector Median |
Comparison |
| Price Estimate |
12.5 |
Higher |
14% Discount |
| Growth Rate |
Above Avg |
Median |
Positive |
| Profitability |
High |
Median |
Stronger |
| Return on Assets |
Above Avg |
Median |
Positive |
| Return on Capital |
Above Avg |
Median |
Positive |
Dividend History and Technical Momentum
REIT’s dividend for next year is estimated at 5.4%. That’s consistent with its history—it’s increased its dividend for 34 years in a row. That’s impressive. It’s one of the reasons I enjoy talking about this fund.
From a technical perspective, the stock has been moving horizontally. But momentum is starting to build again. If it rises to the next resistance level, that’s a 12% upside. Add the dividend, and you’re looking at a potential return of 10% to 17% over the next 6 to 12 months.
Dividend and Technical Outlook
| Metric |
Value |
| Estimated Dividend Yield |
5.4% |
| Dividend Growth Streak |
34 Years |
| Technical Upside |
12% |
| Total Return Potential |
10–17% (6–12 months) |
Final Thoughts: Buy, Hold, or Sell?
So what’s the verdict? REIT has a strong dividend, solid profitability, and a favorable valuation compared to its sector. It’s not a rocket ship, but it’s steady. If you’re looking for high-growth tech stocks, this isn’t it. But if you want consistent income and moderate upside, REIT fits the bill.
Based on the data, the technical setup, and the dividend history, I’d say this stock is a buy—especially for income-focused investors or those looking to balance out a more aggressive portfolio.
If you want to explore other high-dividend real estate funds or compare REIT to VICI Properties, I can help break that down next.
https://youtu.be/Ur80IK7cNng?si=KaMdaPJPQ4G6eCnu











The first real estate fund we’re diving into is VICI REIT. And yes, I’ve got this one in my own portfolio, so I’m not just talking—I’m walking the walk. It ranks number two among top retail-focused real estate funds. Think apartments, shopping centers, and long-term leases. REIT is built for the long haul, and while my personal return hasn’t been stellar—less than 1% since my entry point—it’s still worth a closer look.
Trust and Allocation Matter
The market value of my REIT holding is lower than that of VICI Properties, and that’s not random. It’s about trust. When you trust a stock more, you allocate more. Less confidence? You still might invest, but you’ll scale it down. That’s how allocation works. REIT has earned a five-star rating from Morningstar, which is a solid endorsement. But let’s unpack what that really means.
Morningstar’s five-star rating doesn’t imply REIT has an economic moat. In plain terms, it doesn’t have a strong competitive advantage. Still, the estimated intrinsic value is $49, which is above the current share price. That’s something to keep in mind.
Dividend Strength and Analyst Sentiment
REIT pays out a dividend between 5% and 6%. That’s high. If you get price appreciation on top of that, your total return could be impressive. I expected a bit more from the price side, but the dividend keeps flowing, and that’s a win.
Wall Street analysts aren’t overly enthusiastic. The price target is $44, which is below the intrinsic value. So there’s a bit of a disconnect there. Let’s look at some key metrics to see what’s really going on.
REIT Snapshot
Price to AFO and Return Potential
REIT’s price-to-AFO (Adjusted Funds from Operations) is around 15. That’s the metric we use instead of earnings for real estate funds. Even on a shorter time frame, the numbers hold up. What does that mean? Based on price-to-AFO, you could potentially earn a 14% annual return.
Next year’s price-to-AFO is estimated at 12.75, which is even more attractive. The five-year average sits around 15, so we’re looking at a favorable entry point. That could translate to a total return of 40% over the next 2.5 years. Not bad if you’re aiming for lower-risk investments.
Price-to-AFO Analysis
Valuation and Sector Comparison
REIT scores a strong buy on factor analysis. That’s a tool I value highly. But don’t skip the fundamentals—business strategy, future growth, management. Still, when we compare REIT to the sector median, the numbers look good.
Next year’s price estimate is 12.7 to 12.5, which is about 14% lower than the sector median. That’s a discount. Growth metrics are also slightly above the sector median. So you’ve got lower valuation and better growth. That’s a plus.
Profitability is another win. REIT’s return on total assets and capital are both above the sector median. Green indicators across the board. So yes, lower price tag, better profit, better growth. That’s why it ranks number two in the sector.
Sector Comparison
Dividend History and Technical Momentum
REIT’s dividend for next year is estimated at 5.4%. That’s consistent with its history—it’s increased its dividend for 34 years in a row. That’s impressive. It’s one of the reasons I enjoy talking about this fund.
From a technical perspective, the stock has been moving horizontally. But momentum is starting to build again. If it rises to the next resistance level, that’s a 12% upside. Add the dividend, and you’re looking at a potential return of 10% to 17% over the next 6 to 12 months.
Dividend and Technical Outlook
Final Thoughts: Buy, Hold, or Sell?
So what’s the verdict? REIT has a strong dividend, solid profitability, and a favorable valuation compared to its sector. It’s not a rocket ship, but it’s steady. If you’re looking for high-growth tech stocks, this isn’t it. But if you want consistent income and moderate upside, REIT fits the bill.
Based on the data, the technical setup, and the dividend history, I’d say this stock is a buy—especially for income-focused investors or those looking to balance out a more aggressive portfolio.
If you want to explore other high-dividend real estate funds or compare REIT to VICI Properties, I can help break that down next.
https://youtu.be/Ur80IK7cNng?si=KaMdaPJPQ4G6eCnu