The realm of small-cap stock investing presents a compelling duality: the allure of substantial growth potential juxtaposed with an elevated degree of risk. These smaller companies, often in their nascent stages of development, possess the capacity for rapid expansion, potentially yielding significant returns for investors. However, their size and limited financial cushion render them more susceptible to market volatility and economic downturns. This inherent dynamism necessitates the adoption of sophisticated analytical tools to navigate their unique price movements.
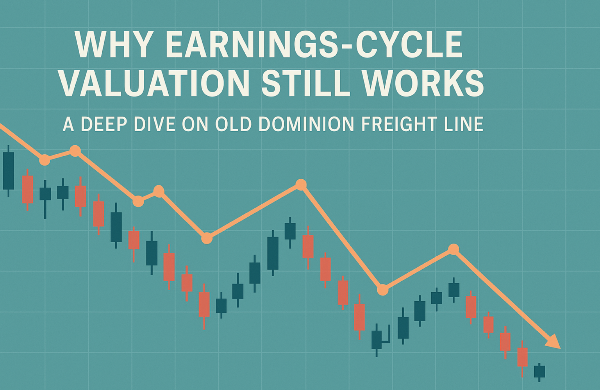
Among the arsenal of techniques available to investors, candlestick charts stand out as a particularly potent method for deciphering market sentiment and anticipating potential price shifts. Originating in 18th-century Japan, where they were used to track the price of rice, these charts have evolved into a cornerstone of modern technical analysis. Their visual nature allows traders to quickly interpret the battle between buyers and sellers, providing valuable clues about future price direction.
This article delves into the specific application of candlestick patterns for navigating the often-turbulent waters of small-cap stock trading. We will explore how to decipher the anatomy of individual candlesticks, identify key bullish and bearish patterns that can signal potential trading opportunities, and understand how to enhance the reliability of these patterns by combining them with other technical indicators. Furthermore, we will discuss the development of tailored trading strategies that account for the unique characteristics of the small-cap market. By the end of this exploration, investors will be equipped with a foundational understanding of how to leverage candlestick analysis to make more informed decisions in their pursuit of small-cap investment success.
Understanding the Language of Candlestick Charts
To effectively utilize candlestick patterns, it is crucial to first grasp the fundamental components that constitute these visual representations of price action. Each candlestick encapsulates the price movements of a security over a specific period, typically a day.
The central rectangular part of the candlestick is known as the body, which represents the range between the opening and closing prices. The color of the body provides a quick visual cue about the direction of price movement. A green or white body typically indicates that the closing price was higher than the opening price, signifying bullish momentum.Conversely, a red or black body indicates that the closing price was lower than the opening price, reflecting bearish pressure.
Extending above and below the body are thin vertical lines known as wicks or shadows. The upper wick represents the highest price reached during the period, while the lower wick indicates the lowest price. The length of these wicks can be particularly informative for small-cap stocks, often revealing the rapid price fluctuations characteristic of this market segment. Long wicks suggest that prices were tested significantly above and below the opening and closing levels, but these moves were ultimately rejected by the market. This can be especially relevant for small-cap stocks, which can experience dramatic intraday swings due to lower liquidity and heightened sensitivity to news.
Candlestick patterns prove particularly valuable in the context of small-cap investing due to the inherent volatility and potential for swift price changes within this market segment. These patterns can serve as early indicators of shifts in investor sentiment, a crucial insight in a market often driven by speculation and news-related reactions. The visual nature of candlestick charts offers a distinct advantage over other charting methods, enabling investors to quickly interpret price action and identify potential trading opportunities. Given the potential for market inefficiencies in small-cap stocks , candlestick patterns can be instrumental in revealing short-term mispricings or momentum shifts that astute traders can capitalize on. The limited analyst coverage and potentially lower institutional involvement in small-cap stocks mean that price action, as visually represented by candlesticks, may more directly reflect the immediate forces of supply and demand driven by individual investors.
Identifying Key Bullish Candlestick Patterns for Small-Cap Opportunities
Bullish candlestick patterns are formations that suggest a potential upward movement in the price of a stock. Recognizing these patterns can help investors identify opportune moments to enter long positions in small-cap stocks.
The Hammer and Inverted Hammer patterns are single-candlestick formations that can signal potential bullish reversals, particularly after a downtrend. The Hammer is characterized by a small body near the top of the trading range and a long lower wick at least twice the length of the body. This pattern suggests that although sellers initially drove the price down, strong buying pressure emerged to push the price back up near the opening, indicating a potential shift in sentiment. The Inverted Hammer has the same shape but appears upside down, with a small body at the bottom and a long upper wick, also suggesting a potential bullish reversal after a downtrend. For instance, if a small-cap stock has been in a decline and a Hammer pattern forms, it could indicate that buyers are stepping in to reject lower prices, potentially signaling a buying opportunity. Confirmation with a subsequent bullish candle is often recommended.
The Bullish Engulfing pattern is a two-candlestick formation that appears after a downtrend and signals strong buying momentum. It consists of a small bearish candle followed by a larger bullish candle that completely engulfs the body of the previous candle. This pattern indicates a strong shift in momentum as buyers overpower sellers. For example, if a small-cap stock has been declining and then a large green candle opens lower than the previous day's low but closes above its high, it suggests significant buying interest has emerged. High volume accompanying this pattern can further strengthen the bullish signal.
The Morning Star is a three-candlestick pattern that appears at the bottom of a downtrend, signaling the potential start of an uptrend. The pattern begins with a long bearish candle, followed by a small-bodied candle (the "star") that gaps down, and concludes with a strong bullish candle that closes above the midpoint of the first candle. This pattern indicates a shift from bearish dominance to uncertainty and then to bullish control. A Morning Star appearing in a small-cap stock that has been in a decline could suggest a potential turnaround, especially if positive news or improving fundamentals emerge. A variation, the Morning Star Doji, where the middle candle is a Doji, is often considered an even stronger signal.
Three White Soldiers is a bullish continuation pattern that can also occur after a downtrend, indicating sustained buying pressure. It is characterized by three consecutive long bullish candles that close progressively higher, with small wicks. If a small-cap stock breaks out of a consolidation phase and is followed by this pattern, it can confirm the strength of the breakout and suggest a potential sustained upward trend. This pattern is most reliable after a period of downtrend or price consolidation.
Recognizing Bearish Candlestick Patterns for Small-Cap Risk Management
Bearish candlestick patterns are formations that can indicate a potential downward movement in the price of a stock. Identifying these patterns is crucial for small-cap investors to manage risk and potentially profit from short-selling opportunities.
The Hanging Man and Shooting Star are single-candlestick bearish reversal patterns that typically form after an uptrend.The Hanging Man has a small body at the top of the trading range and a long lower wick, suggesting that despite a significant sell-off during the session, buyers managed to push the price back up, but the selling pressure indicates potential weakness. The Shooting Star has the same shape as an inverted hammer but appears after an uptrend, with a small body at the bottom and a long upper wick, indicating that buyers initially pushed the price higher but were met with strong selling pressure. If a small-cap stock that has rallied shows either of these patterns, it could signal a potential downturn or profit-taking. Confirmation with subsequent bearish price action is advisable.
The Bearish Engulfing pattern is a two-candlestick pattern that occurs after an uptrend, suggesting a reversal to a downtrend. It consists of a small bullish candle followed by a larger bearish candle that completely engulfs the body of the previous candle. This pattern suggests that selling pressure has overtaken buying pressure. If a small-cap stock that has been rallying shows this pattern, especially at a resistance level, it could indicate a high-probability short-selling opportunity.
The Evening Star is a three-candlestick bearish reversal pattern that appears at the peak of an uptrend. It starts with a long bullish candle, followed by a small-bodied candle (the "star") that gaps up, and concludes with a strong bearish candle that closes below the midpoint of the first candle. This pattern signifies the end of bullish momentum and the potential start of a downtrend. An Evening Star appearing after high buying volume in a small-cap stock could suggest exhaustion of the uptrend. Similar to the Morning Star, an Evening Star Doji, with a Doji as the middle candle, is considered a stronger bearish signal.
Three Black Crows is a bearish continuation pattern that can also signal the start of a downtrend. It consists of three consecutive long bearish candles with short wicks, each opening within the previous candle's body and closing lower. If a small-cap stock breaks below a support level and is followed by this pattern with increasing volume, it can confirm the start of a significant downtrend.
Combining Candlestick Patterns with Technical Indicators for Enhanced Small-Cap Trading
While candlestick patterns offer valuable insights into potential price movements, their reliability can be significantly enhanced when used in conjunction with other technical analysis tools. This is particularly true for the volatile landscape of small-cap stocks.
Leveraging Volume to Confirm Candlestick Signals is a crucial aspect of technical analysis. Trading volume, which represents the number of shares traded during a specific period, can provide vital confirmation of the strength behind a candlestick pattern. High volume accompanying a bullish reversal pattern like a Hammer or a Bullish Engulfing suggests strong buying interest and increases the likelihood of the reversal being successful. Conversely, high volume alongside a bearish pattern like a Shooting Star or a Bearish Engulfing can confirm strong selling pressure. In the context of small-cap stocks, where liquidity can be a concern, significant volume accompanying a candlestick pattern lends more credence to the signal, indicating genuine market participation rather than potential manipulation or isolated trading activity.
Utilizing Moving Averages to Identify Trends and Support/Resistance can further refine the interpretation of candlestick patterns. Moving averages smooth out price data over a specified period, helping to identify the underlying trend. They can also act as dynamic support and resistance levels, particularly in trending markets. For small-cap stocks, where trends can be more fleeting, shorter-term moving averages like the 20-day or 50-day might be particularly useful. A bullish candlestick pattern forming above a rising moving average can indicate strong upside momentum, while a bearish pattern appearing below a falling moving average might suggest continued downward pressure.
The Relative Strength Index (RSI) is a momentum oscillator that measures the speed and change of price movements, helping to identify overbought and oversold conditions. For small-cap stocks, which can experience rapid and potentially overextended price swings, RSI can be invaluable. A bullish candlestick pattern, such as a Hammer, appearing when the RSI is below 30 (oversold) can provide a stronger indication of a potential upward reversal. Similarly, a bearish pattern like a Shooting Star forming when the RSI is above 70 (overbought) can strengthen the signal for a potential downward move.
The Moving Average Convergence Divergence (MACD) is a trend-following momentum indicator that can also be used to confirm candlestick patterns. MACD identifies trend direction and potential changes in momentum through the relationship between two moving averages. A bullish crossover on the MACD (when the MACD line crosses above the signal line) occurring around the same time as a bullish candlestick pattern can provide stronger confirmation of an upward trend. Conversely, a bearish crossover coinciding with a bearish candlestick pattern can signal a potential downtrend. MACD divergences, where the price action diverges from the MACD indicator, can also provide early warnings of potential trend reversals that align with candlestick patterns.
Candlestick Pattern Description Potential RSI Confirmation Potential MACD Confirmation Potential Volume Confirmation
Bullish Patterns
Hammer Small body, long lower wick after downtrend Oversold (<30) Bullish Crossover Increased Volume
Inverted Hammer Small body, long upper wick after downtrend Oversold (<30) Bullish Crossover Increased Volume
Bullish Engulfing Bullish candle engulfs prior bearish candle after downtrend Oversold (<30) Bullish Crossover Increased Volume
Morning Star Three-candle bullish reversal at bottom of downtrend Oversold (<30) Bullish Crossover Increased Volume on 3rd Candle
Three White Soldiers Three consecutive long bullish candles after downtrend/consolidation Rising from neutral Bullish Trend Initiation Steadily Increasing Volume
Bearish Patterns
Hanging Man Small body, long lower wick after uptrend Overbought (>70) Bearish Crossover Increased Volume
Shooting Star Small body, long upper wick after uptrend Overbought (>70) Bearish Crossover Increased Volume
Bearish Engulfing Bearish candle engulfs prior bullish candle after uptrend Overbought (>70) Bearish Crossover Increased Volume
Evening Star Three-candle bearish reversal at top of uptrend Overbought (>70) Bearish Crossover Increased Volume on 3rd Candle
Three Black Crows Three consecutive long bearish candles after uptrend/consolidation Falling from neutral Bearish Trend Initiation Steadily Increasing Volume
Export to Sheets
Developing Trading Strategies for Small-Cap Stocks Using Candlestick Analysis
Applying candlestick patterns to small-cap stock trading requires a strategic approach that considers the unique characteristics of this market segment.
Identifying Entry and Exit Points with Precision is a key advantage of using candlestick patterns. Bullish patterns like the Hammer or Bullish Engulfing can serve as entry signals after a period of price decline or consolidation, suggesting that buying pressure is emerging. Conversely, bearish patterns such as the Hanging Man or Bearish Engulfing can indicate potential exit points for long positions or opportunities to enter short positions after an uptrend. It is crucial to always wait for the complete formation of the candlestick pattern and seek confirmation from other indicators or subsequent price action before initiating a trade.
Setting Stop-Loss Orders Based on Candlestick Formations is a vital risk management practice, especially in the volatile realm of small-cap stocks. For bullish reversal patterns, the low of the pattern can often serve as a logical level for placing a stop-loss order. For instance, if trading based on a Hammer pattern, placing a stop-loss just below the low of the Hammer can help limit potential losses if the expected upward move does not occur. Similarly, for bearish reversal patterns, the high of the pattern can be used as a stop-loss level. Given the propensity for significant price swings in small-cap stocks, employing appropriate stop-loss orders is essential to protect investment capital.
Considering Profit Targets and Risk-Reward Ratios is crucial for successful trading. Profit targets can be set based on nearby resistance levels for bullish trades or support levels for bearish trades. Given the higher potential for both gains and losses in small-cap stocks, maintaining a favorable risk-reward ratio, such as aiming for a profit that is at least twice the potential loss (2:1 ratio), is crucial for long-term success.
Hypothetical Case Study: Trading a Small-Cap Breakout with a Bullish Engulfing Pattern: Imagine a small-cap stock that has been trading in a narrow range between $10 and $11 for several weeks. Suddenly, the company announces positive earnings news, and the stock gaps up to $11.20 on strong volume. The next day, the stock opens slightly lower at $11.10 but then rallies strongly, forming a large green candle that closes at $11.80, completely engulfing the previous day's smaller red candle. This bullish engulfing pattern, occurring after a breakout on high volume, suggests strong buying momentum. A trader might enter a long position near the close of the engulfing candle at $11.80, place a stop-loss just below the low of the pattern at $11.05, and set a profit target at the next resistance level, perhaps around $12.50, aiming for a risk-reward ratio greater than 2:1.
Hypothetical Case Study: Managing Risk During a Downtrend Using a Bearish Pattern: Consider a small-cap stock that has been in a strong uptrend, reaching a high of $25. However, the stock then encounters resistance at this level and begins to consolidate. One day, after a small green candle, a large red candle forms, opening slightly higher than the previous close but then declining sharply to close at $23.50, engulfing the entire body of the prior bullish candle. This bearish engulfing pattern at a resistance level suggests a potential reversal. A trader holding a long position might consider exiting near the close of this bearish candle to protect profits. A more aggressive trader might even consider a short entry at $23.50, placing a stop-loss just above the high of the engulfing candle at $25.10, and targeting a profit near the previous support level around $22.
Navigating the Unique Characteristics of Small-Cap Stocks with Candlestick Patterns
Trading small-cap stocks using candlestick patterns necessitates an awareness of the unique characteristics of this market segment, particularly its volatility and liquidity.
The inherent volatility of small-cap stocks can lead to more frequent and potentially less reliable candlestick patterns. The rapid price swings often seen in these stocks can generate patterns that might not always reflect a genuine shift in underlying sentiment. Therefore, it is crucial to seek stronger confirmation from other technical indicators or subsequent price action when trading small-cap stocks based on candlestick patterns. Investors should be wary of "false signals," where a pattern appears but the price moves in the opposite direction. Employing multiple layers of analysis can help mitigate this risk.
The level of liquidity in a small-cap stock can also significantly impact the formation and interpretation of candlestick patterns. Lower liquidity can lead to price gaps and erratic movements, potentially making candlestick patterns less reliable indicators of genuine market sentiment. Wide bid-ask spreads, common in less liquid small-cap stocks, can affect the actual entry and exit prices achieved by traders. Therefore, when analyzing candlestick patterns in small-cap stocks, it is essential to consider the liquidity of the specific stock. Higher volume accompanying a pattern in a small-cap stock can often lend more validity to the signal.
Conclusion: Mastering Candlestick Patterns for Informed Small-Cap Investment Decisions
In conclusion, candlestick patterns offer a powerful visual framework for understanding market sentiment and identifying potential trading opportunities within the dynamic world of small-cap stocks. By mastering the anatomy of individual candlesticks and recognizing key bullish and bearish formations, investors can gain a valuable edge in navigating the often-volatile price action of this market segment.
However, it is crucial to remember that relying solely on candlestick patterns is not a foolproof strategy. To enhance the reliability of these patterns, especially in the context of small-cap stocks, it is essential to integrate them with other technical analysis tools such as volume indicators, moving averages, and momentum oscillators like the RSI and MACD. Furthermore, a thorough understanding of the unique characteristics of small-cap stocks, including their inherent volatility and potential for lower liquidity, is paramount for effective pattern interpretation and risk management.
Ultimately, the skillful application of candlestick analysis in small-cap investing requires practice, patience, and a commitment to continuous learning. By diligently studying charts, observing how different patterns play out in various market conditions, and combining this knowledge with a broader understanding of technical and fundamental analysis, investors can empower themselves to make more informed and potentially profitable investment decisions in the exciting and often rewarding realm of small-cap stocks.














The realm of small-cap stock investing presents a compelling duality: the allure of substantial growth potential juxtaposed with an elevated degree of risk. These smaller companies, often in their nascent stages of development, possess the capacity for rapid expansion, potentially yielding significant returns for investors. However, their size and limited financial cushion render them more susceptible to market volatility and economic downturns. This inherent dynamism necessitates the adoption of sophisticated analytical tools to navigate their unique price movements.
Among the arsenal of techniques available to investors, candlestick charts stand out as a particularly potent method for deciphering market sentiment and anticipating potential price shifts. Originating in 18th-century Japan, where they were used to track the price of rice, these charts have evolved into a cornerstone of modern technical analysis. Their visual nature allows traders to quickly interpret the battle between buyers and sellers, providing valuable clues about future price direction.
This article delves into the specific application of candlestick patterns for navigating the often-turbulent waters of small-cap stock trading. We will explore how to decipher the anatomy of individual candlesticks, identify key bullish and bearish patterns that can signal potential trading opportunities, and understand how to enhance the reliability of these patterns by combining them with other technical indicators. Furthermore, we will discuss the development of tailored trading strategies that account for the unique characteristics of the small-cap market. By the end of this exploration, investors will be equipped with a foundational understanding of how to leverage candlestick analysis to make more informed decisions in their pursuit of small-cap investment success. Understanding the Language of Candlestick Charts To effectively utilize candlestick patterns, it is crucial to first grasp the fundamental components that constitute these visual representations of price action. Each candlestick encapsulates the price movements of a security over a specific period, typically a day.
The central rectangular part of the candlestick is known as the body, which represents the range between the opening and closing prices. The color of the body provides a quick visual cue about the direction of price movement. A green or white body typically indicates that the closing price was higher than the opening price, signifying bullish momentum.Conversely, a red or black body indicates that the closing price was lower than the opening price, reflecting bearish pressure.
Extending above and below the body are thin vertical lines known as wicks or shadows. The upper wick represents the highest price reached during the period, while the lower wick indicates the lowest price. The length of these wicks can be particularly informative for small-cap stocks, often revealing the rapid price fluctuations characteristic of this market segment. Long wicks suggest that prices were tested significantly above and below the opening and closing levels, but these moves were ultimately rejected by the market. This can be especially relevant for small-cap stocks, which can experience dramatic intraday swings due to lower liquidity and heightened sensitivity to news.
Candlestick patterns prove particularly valuable in the context of small-cap investing due to the inherent volatility and potential for swift price changes within this market segment. These patterns can serve as early indicators of shifts in investor sentiment, a crucial insight in a market often driven by speculation and news-related reactions. The visual nature of candlestick charts offers a distinct advantage over other charting methods, enabling investors to quickly interpret price action and identify potential trading opportunities. Given the potential for market inefficiencies in small-cap stocks , candlestick patterns can be instrumental in revealing short-term mispricings or momentum shifts that astute traders can capitalize on. The limited analyst coverage and potentially lower institutional involvement in small-cap stocks mean that price action, as visually represented by candlesticks, may more directly reflect the immediate forces of supply and demand driven by individual investors.
Identifying Key Bullish Candlestick Patterns for Small-Cap Opportunities Bullish candlestick patterns are formations that suggest a potential upward movement in the price of a stock. Recognizing these patterns can help investors identify opportune moments to enter long positions in small-cap stocks. The Hammer and Inverted Hammer patterns are single-candlestick formations that can signal potential bullish reversals, particularly after a downtrend. The Hammer is characterized by a small body near the top of the trading range and a long lower wick at least twice the length of the body. This pattern suggests that although sellers initially drove the price down, strong buying pressure emerged to push the price back up near the opening, indicating a potential shift in sentiment. The Inverted Hammer has the same shape but appears upside down, with a small body at the bottom and a long upper wick, also suggesting a potential bullish reversal after a downtrend. For instance, if a small-cap stock has been in a decline and a Hammer pattern forms, it could indicate that buyers are stepping in to reject lower prices, potentially signaling a buying opportunity. Confirmation with a subsequent bullish candle is often recommended.
The Bullish Engulfing pattern is a two-candlestick formation that appears after a downtrend and signals strong buying momentum. It consists of a small bearish candle followed by a larger bullish candle that completely engulfs the body of the previous candle. This pattern indicates a strong shift in momentum as buyers overpower sellers. For example, if a small-cap stock has been declining and then a large green candle opens lower than the previous day's low but closes above its high, it suggests significant buying interest has emerged. High volume accompanying this pattern can further strengthen the bullish signal.
The Morning Star is a three-candlestick pattern that appears at the bottom of a downtrend, signaling the potential start of an uptrend. The pattern begins with a long bearish candle, followed by a small-bodied candle (the "star") that gaps down, and concludes with a strong bullish candle that closes above the midpoint of the first candle. This pattern indicates a shift from bearish dominance to uncertainty and then to bullish control. A Morning Star appearing in a small-cap stock that has been in a decline could suggest a potential turnaround, especially if positive news or improving fundamentals emerge. A variation, the Morning Star Doji, where the middle candle is a Doji, is often considered an even stronger signal.
Three White Soldiers is a bullish continuation pattern that can also occur after a downtrend, indicating sustained buying pressure. It is characterized by three consecutive long bullish candles that close progressively higher, with small wicks. If a small-cap stock breaks out of a consolidation phase and is followed by this pattern, it can confirm the strength of the breakout and suggest a potential sustained upward trend. This pattern is most reliable after a period of downtrend or price consolidation.
Recognizing Bearish Candlestick Patterns for Small-Cap Risk Management Bearish candlestick patterns are formations that can indicate a potential downward movement in the price of a stock. Identifying these patterns is crucial for small-cap investors to manage risk and potentially profit from short-selling opportunities. The Hanging Man and Shooting Star are single-candlestick bearish reversal patterns that typically form after an uptrend.The Hanging Man has a small body at the top of the trading range and a long lower wick, suggesting that despite a significant sell-off during the session, buyers managed to push the price back up, but the selling pressure indicates potential weakness. The Shooting Star has the same shape as an inverted hammer but appears after an uptrend, with a small body at the bottom and a long upper wick, indicating that buyers initially pushed the price higher but were met with strong selling pressure. If a small-cap stock that has rallied shows either of these patterns, it could signal a potential downturn or profit-taking. Confirmation with subsequent bearish price action is advisable.
The Bearish Engulfing pattern is a two-candlestick pattern that occurs after an uptrend, suggesting a reversal to a downtrend. It consists of a small bullish candle followed by a larger bearish candle that completely engulfs the body of the previous candle. This pattern suggests that selling pressure has overtaken buying pressure. If a small-cap stock that has been rallying shows this pattern, especially at a resistance level, it could indicate a high-probability short-selling opportunity.
The Evening Star is a three-candlestick bearish reversal pattern that appears at the peak of an uptrend. It starts with a long bullish candle, followed by a small-bodied candle (the "star") that gaps up, and concludes with a strong bearish candle that closes below the midpoint of the first candle. This pattern signifies the end of bullish momentum and the potential start of a downtrend. An Evening Star appearing after high buying volume in a small-cap stock could suggest exhaustion of the uptrend. Similar to the Morning Star, an Evening Star Doji, with a Doji as the middle candle, is considered a stronger bearish signal.
Three Black Crows is a bearish continuation pattern that can also signal the start of a downtrend. It consists of three consecutive long bearish candles with short wicks, each opening within the previous candle's body and closing lower. If a small-cap stock breaks below a support level and is followed by this pattern with increasing volume, it can confirm the start of a significant downtrend.
Combining Candlestick Patterns with Technical Indicators for Enhanced Small-Cap Trading While candlestick patterns offer valuable insights into potential price movements, their reliability can be significantly enhanced when used in conjunction with other technical analysis tools. This is particularly true for the volatile landscape of small-cap stocks. Leveraging Volume to Confirm Candlestick Signals is a crucial aspect of technical analysis. Trading volume, which represents the number of shares traded during a specific period, can provide vital confirmation of the strength behind a candlestick pattern. High volume accompanying a bullish reversal pattern like a Hammer or a Bullish Engulfing suggests strong buying interest and increases the likelihood of the reversal being successful. Conversely, high volume alongside a bearish pattern like a Shooting Star or a Bearish Engulfing can confirm strong selling pressure. In the context of small-cap stocks, where liquidity can be a concern, significant volume accompanying a candlestick pattern lends more credence to the signal, indicating genuine market participation rather than potential manipulation or isolated trading activity.
Utilizing Moving Averages to Identify Trends and Support/Resistance can further refine the interpretation of candlestick patterns. Moving averages smooth out price data over a specified period, helping to identify the underlying trend. They can also act as dynamic support and resistance levels, particularly in trending markets. For small-cap stocks, where trends can be more fleeting, shorter-term moving averages like the 20-day or 50-day might be particularly useful. A bullish candlestick pattern forming above a rising moving average can indicate strong upside momentum, while a bearish pattern appearing below a falling moving average might suggest continued downward pressure.
The Relative Strength Index (RSI) is a momentum oscillator that measures the speed and change of price movements, helping to identify overbought and oversold conditions. For small-cap stocks, which can experience rapid and potentially overextended price swings, RSI can be invaluable. A bullish candlestick pattern, such as a Hammer, appearing when the RSI is below 30 (oversold) can provide a stronger indication of a potential upward reversal. Similarly, a bearish pattern like a Shooting Star forming when the RSI is above 70 (overbought) can strengthen the signal for a potential downward move.
The Moving Average Convergence Divergence (MACD) is a trend-following momentum indicator that can also be used to confirm candlestick patterns. MACD identifies trend direction and potential changes in momentum through the relationship between two moving averages. A bullish crossover on the MACD (when the MACD line crosses above the signal line) occurring around the same time as a bullish candlestick pattern can provide stronger confirmation of an upward trend. Conversely, a bearish crossover coinciding with a bearish candlestick pattern can signal a potential downtrend. MACD divergences, where the price action diverges from the MACD indicator, can also provide early warnings of potential trend reversals that align with candlestick patterns.
Candlestick Pattern Description Potential RSI Confirmation Potential MACD Confirmation Potential Volume Confirmation Bullish Patterns
Hammer Small body, long lower wick after downtrend Oversold (<30) Bullish Crossover Increased Volume Inverted Hammer Small body, long upper wick after downtrend Oversold (<30) Bullish Crossover Increased Volume Bullish Engulfing Bullish candle engulfs prior bearish candle after downtrend Oversold (<30) Bullish Crossover Increased Volume Morning Star Three-candle bullish reversal at bottom of downtrend Oversold (<30) Bullish Crossover Increased Volume on 3rd Candle Three White Soldiers Three consecutive long bullish candles after downtrend/consolidation Rising from neutral Bullish Trend Initiation Steadily Increasing Volume Bearish Patterns
Hanging Man Small body, long lower wick after uptrend Overbought (>70) Bearish Crossover Increased Volume Shooting Star Small body, long upper wick after uptrend Overbought (>70) Bearish Crossover Increased Volume Bearish Engulfing Bearish candle engulfs prior bullish candle after uptrend Overbought (>70) Bearish Crossover Increased Volume Evening Star Three-candle bearish reversal at top of uptrend Overbought (>70) Bearish Crossover Increased Volume on 3rd Candle Three Black Crows Three consecutive long bearish candles after uptrend/consolidation Falling from neutral Bearish Trend Initiation Steadily Increasing Volume Export to Sheets Developing Trading Strategies for Small-Cap Stocks Using Candlestick Analysis Applying candlestick patterns to small-cap stock trading requires a strategic approach that considers the unique characteristics of this market segment. Identifying Entry and Exit Points with Precision is a key advantage of using candlestick patterns. Bullish patterns like the Hammer or Bullish Engulfing can serve as entry signals after a period of price decline or consolidation, suggesting that buying pressure is emerging. Conversely, bearish patterns such as the Hanging Man or Bearish Engulfing can indicate potential exit points for long positions or opportunities to enter short positions after an uptrend. It is crucial to always wait for the complete formation of the candlestick pattern and seek confirmation from other indicators or subsequent price action before initiating a trade.
Setting Stop-Loss Orders Based on Candlestick Formations is a vital risk management practice, especially in the volatile realm of small-cap stocks. For bullish reversal patterns, the low of the pattern can often serve as a logical level for placing a stop-loss order. For instance, if trading based on a Hammer pattern, placing a stop-loss just below the low of the Hammer can help limit potential losses if the expected upward move does not occur. Similarly, for bearish reversal patterns, the high of the pattern can be used as a stop-loss level. Given the propensity for significant price swings in small-cap stocks, employing appropriate stop-loss orders is essential to protect investment capital.
Considering Profit Targets and Risk-Reward Ratios is crucial for successful trading. Profit targets can be set based on nearby resistance levels for bullish trades or support levels for bearish trades. Given the higher potential for both gains and losses in small-cap stocks, maintaining a favorable risk-reward ratio, such as aiming for a profit that is at least twice the potential loss (2:1 ratio), is crucial for long-term success.
Hypothetical Case Study: Trading a Small-Cap Breakout with a Bullish Engulfing Pattern: Imagine a small-cap stock that has been trading in a narrow range between $10 and $11 for several weeks. Suddenly, the company announces positive earnings news, and the stock gaps up to $11.20 on strong volume. The next day, the stock opens slightly lower at $11.10 but then rallies strongly, forming a large green candle that closes at $11.80, completely engulfing the previous day's smaller red candle. This bullish engulfing pattern, occurring after a breakout on high volume, suggests strong buying momentum. A trader might enter a long position near the close of the engulfing candle at $11.80, place a stop-loss just below the low of the pattern at $11.05, and set a profit target at the next resistance level, perhaps around $12.50, aiming for a risk-reward ratio greater than 2:1. Hypothetical Case Study: Managing Risk During a Downtrend Using a Bearish Pattern: Consider a small-cap stock that has been in a strong uptrend, reaching a high of $25. However, the stock then encounters resistance at this level and begins to consolidate. One day, after a small green candle, a large red candle forms, opening slightly higher than the previous close but then declining sharply to close at $23.50, engulfing the entire body of the prior bullish candle. This bearish engulfing pattern at a resistance level suggests a potential reversal. A trader holding a long position might consider exiting near the close of this bearish candle to protect profits. A more aggressive trader might even consider a short entry at $23.50, placing a stop-loss just above the high of the engulfing candle at $25.10, and targeting a profit near the previous support level around $22. Navigating the Unique Characteristics of Small-Cap Stocks with Candlestick Patterns Trading small-cap stocks using candlestick patterns necessitates an awareness of the unique characteristics of this market segment, particularly its volatility and liquidity. The inherent volatility of small-cap stocks can lead to more frequent and potentially less reliable candlestick patterns. The rapid price swings often seen in these stocks can generate patterns that might not always reflect a genuine shift in underlying sentiment. Therefore, it is crucial to seek stronger confirmation from other technical indicators or subsequent price action when trading small-cap stocks based on candlestick patterns. Investors should be wary of "false signals," where a pattern appears but the price moves in the opposite direction. Employing multiple layers of analysis can help mitigate this risk.
The level of liquidity in a small-cap stock can also significantly impact the formation and interpretation of candlestick patterns. Lower liquidity can lead to price gaps and erratic movements, potentially making candlestick patterns less reliable indicators of genuine market sentiment. Wide bid-ask spreads, common in less liquid small-cap stocks, can affect the actual entry and exit prices achieved by traders. Therefore, when analyzing candlestick patterns in small-cap stocks, it is essential to consider the liquidity of the specific stock. Higher volume accompanying a pattern in a small-cap stock can often lend more validity to the signal.
Conclusion: Mastering Candlestick Patterns for Informed Small-Cap Investment Decisions In conclusion, candlestick patterns offer a powerful visual framework for understanding market sentiment and identifying potential trading opportunities within the dynamic world of small-cap stocks. By mastering the anatomy of individual candlesticks and recognizing key bullish and bearish formations, investors can gain a valuable edge in navigating the often-volatile price action of this market segment. However, it is crucial to remember that relying solely on candlestick patterns is not a foolproof strategy. To enhance the reliability of these patterns, especially in the context of small-cap stocks, it is essential to integrate them with other technical analysis tools such as volume indicators, moving averages, and momentum oscillators like the RSI and MACD. Furthermore, a thorough understanding of the unique characteristics of small-cap stocks, including their inherent volatility and potential for lower liquidity, is paramount for effective pattern interpretation and risk management. Ultimately, the skillful application of candlestick analysis in small-cap investing requires practice, patience, and a commitment to continuous learning. By diligently studying charts, observing how different patterns play out in various market conditions, and combining this knowledge with a broader understanding of technical and fundamental analysis, investors can empower themselves to make more informed and potentially profitable investment decisions in the exciting and often rewarding realm of small-cap stocks.