Hello, this is Chuck Carnival, co-founder of Fast Graphs—the fundamentals analyzer software tool—aka Mr. Valuation. Today, I’m bringing you another lesson in valuation, part of the subscriber request series: a two-minute drill on T. Rowe Price (TROW).
A True Income Investment
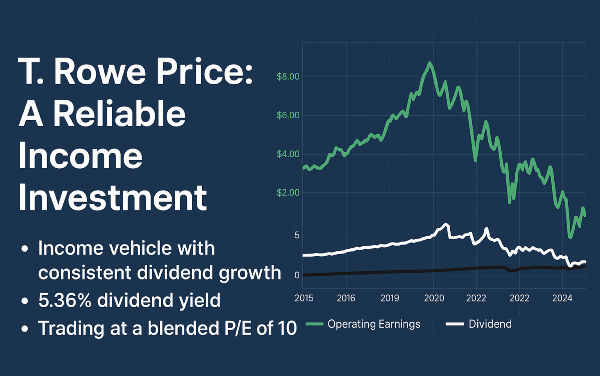
I’ve received several requests to cover this stock, and I want to make one thing crystal clear: this is an income vehicle. If you’re looking for a stock focused on delivering consistent dividends, this one fits the bill.
Evaluating Operating Earnings and Dividend Growth
Looking at the Fast Graphs chart, we see the operating earnings plotted from 2016 to 2020. This period represents a golden age for the money management business, with earnings demonstrating remarkable strength. However, while earnings are important, I want to highlight something even more crucial—the dividend line (shown in white).
What stands out is the consistent growth in dividends, apart from a few peaks where the dividend spiked dramatically. These increases were due to special dividends, which the company has offered at times. While special dividends are a nice bonus, they are not guaranteed, meaning investors should not rely on them when assessing the stock’s future cash flow potential.
Dividend Yield and Historical Performance
At present, T. Rowe Price offers a 5.36% dividend yield, a rate that has grown year after year. Compared to broader market performance, this stock stands out. Looking at historical performance:
- Since December 2004, a $10,000 investment in T. Rowe Price would have generated $17,000 in dividends.
- By contrast, the same investment in the S&P 500 would have produced less than $7,000 in dividends over the same period.
This comparison underscores why T. Rowe Price is a true income stock, providing stable and reliable returns to long-term investors.
Read More: 5 Stocks That May be Better than T. Rowe Price
| Company Name |
Symbol |
Why It's Better Than TROW |
| Bank of New York Mellon |
BK |
Offers a broader range of financial services beyond asset management, including custody and investment banking. |
| Ameriprise Financial |
AMP |
Stronger growth prospects with diversified financial planning and wealth management services. |
| State Street |
STT |
Higher institutional ownership and a more extensive global presence in asset servicing. |
| Northern Trust |
NTRS |
More specialized in high-net-worth and institutional asset management, offering stability. |
| Franklin Resources |
BEN |
Competitive dividend yield and a strong focus on global investment strategies. |
Cash Flow Strength
For income stocks like this, one of the most critical metrics to consider is operating cash flow. Looking at the Fast Graphs chart, you’ll see the orange line, representing operating cash flow. This metric is vital because we want to ensure that cash flow remains higher than dividends.
Examining the historical data, we can see that T. Rowe Price consistently generates much higher operating cash flow than its dividend payments, even when paying special dividends.
Even more important than operating cash flow is free cash flow to equity. If we examine free cash flow, we see that T. Rowe Price has generated more free cash flow to equity than it has paid out in dividends. This reinforces the company’s ability to maintain and grow its dividend payments sustainably.
Current Valuation: A Buying Opportunity?
Looking at today’s valuation, we return to the adjusted operating earnings and overlay weekly closing stock prices. Historically, the market has valued T. Rowe Price at an 18x price-to-earnings multiple, and we can see that stock prices have closely tracked earnings over time.
Here’s where it gets interesting:
- Right now, the stock is trading at a blended P/E ratio of 10, significantly below its historical average.
- The intrinsic value estimate suggests a theoretical valuation of 14, which would imply a potential 20% upside.
- Investors buying in at current levels benefit from over a 5% dividend yield while waiting for price appreciation.
Final Thoughts
In summary, T. Rowe Price remains an attractive income investment with a strong dividend track record, sustainable cash flow, and an undervalued stock price. The historical performance and stable cash flow make it a compelling choice for dividend-focused investors.
If you found this analysis helpful, give this article a like, ring the bell, and subscribe to Fast Graphs. Stay tuned for more insights in future valuation lessons.
Read More: 5 More Dividend Stocks that may be Better than T. Rowe Price
| Company Name |
Symbol |
Why It's a Better Income Stock Than TROW |
| PepsiCo |
PEP |
Consistent dividend growth for over 50 years, strong brand portfolio, and defensive consumer staples sector. |
| W.P. Carey |
WPC |
High-yielding real estate investment trust (REIT) with stable rental income and inflation-protected leases. |
| ExxonMobil |
XOM |
Strong dividend yield backed by global energy demand and disciplined capital allocation. |
| Johnson & Johnson |
JNJ |
Dividend aristocrat with a diversified healthcare portfolio and reliable cash flow. |
| Realty Income |
O |
Monthly dividend payer with a long history of stable and growing distributions from real estate assets. |
https://youtu.be/xBHjvVnxMJU?si=6F5_IqJVS7HXUEB2


Hello, this is Chuck Carnival, co-founder of Fast Graphs—the fundamentals analyzer software tool—aka Mr. Valuation. Today, I’m bringing you another lesson in valuation, part of the subscriber request series: a two-minute drill on T. Rowe Price (TROW).
A True Income Investment
I’ve received several requests to cover this stock, and I want to make one thing crystal clear: this is an income vehicle. If you’re looking for a stock focused on delivering consistent dividends, this one fits the bill.
Evaluating Operating Earnings and Dividend Growth
Looking at the Fast Graphs chart, we see the operating earnings plotted from 2016 to 2020. This period represents a golden age for the money management business, with earnings demonstrating remarkable strength. However, while earnings are important, I want to highlight something even more crucial—the dividend line (shown in white).
What stands out is the consistent growth in dividends, apart from a few peaks where the dividend spiked dramatically. These increases were due to special dividends, which the company has offered at times. While special dividends are a nice bonus, they are not guaranteed, meaning investors should not rely on them when assessing the stock’s future cash flow potential.
Dividend Yield and Historical Performance
At present, T. Rowe Price offers a 5.36% dividend yield, a rate that has grown year after year. Compared to broader market performance, this stock stands out. Looking at historical performance:
This comparison underscores why T. Rowe Price is a true income stock, providing stable and reliable returns to long-term investors.
Cash Flow Strength
For income stocks like this, one of the most critical metrics to consider is operating cash flow. Looking at the Fast Graphs chart, you’ll see the orange line, representing operating cash flow. This metric is vital because we want to ensure that cash flow remains higher than dividends.
Examining the historical data, we can see that T. Rowe Price consistently generates much higher operating cash flow than its dividend payments, even when paying special dividends.
Even more important than operating cash flow is free cash flow to equity. If we examine free cash flow, we see that T. Rowe Price has generated more free cash flow to equity than it has paid out in dividends. This reinforces the company’s ability to maintain and grow its dividend payments sustainably.
Current Valuation: A Buying Opportunity?
Looking at today’s valuation, we return to the adjusted operating earnings and overlay weekly closing stock prices. Historically, the market has valued T. Rowe Price at an 18x price-to-earnings multiple, and we can see that stock prices have closely tracked earnings over time.
Here’s where it gets interesting:
Final Thoughts
In summary, T. Rowe Price remains an attractive income investment with a strong dividend track record, sustainable cash flow, and an undervalued stock price. The historical performance and stable cash flow make it a compelling choice for dividend-focused investors.
If you found this analysis helpful, give this article a like, ring the bell, and subscribe to Fast Graphs. Stay tuned for more insights in future valuation lessons.
https://youtu.be/xBHjvVnxMJU?si=6F5_IqJVS7HXUEB2