What Metrics are used in Value Investing?
Value investing is a strategy that looks to determine if the market has undervalued a stock, and there are many metrics that can help you discover these opportunities.
There are two key categories of metrics that are used in value investing:
- Discovery metrics – These metrics are rudimentary, typically ratios, that can be used to filter through a list of companies to find opportunities. They are not good for making a final decision to invest in a company.
- valuation metrics - The key valuation metrics are intrinsic value and risk factors. These are the fundamental metrics value investors use to make a final decision to invest. Discovery metrics are typically partial pieces of intrinsic value and give a quick glance of the intrinsic value.
What is the Best Valuation Metric?
For stable company’s, calculating the intrinsic value of a stock is the best valuation metric. By discounting earnings per share over a ten year period by the 10 year t-note and adding in the book value per share, you get an intrinsic value of the company. This is similar to the process laid out in Buffetology.
This process is also summarized at bivio.com.
What are the Most Popular Valuation Metrics?
The most popular valuation metric is the P/E ratio. Since 2004, the price to earnings ratio has stood the test of time as the top searched valuation metric. The next most searched topic is return on equity, followed by dividend yield, and in last PEG ratio and price to book ratio.
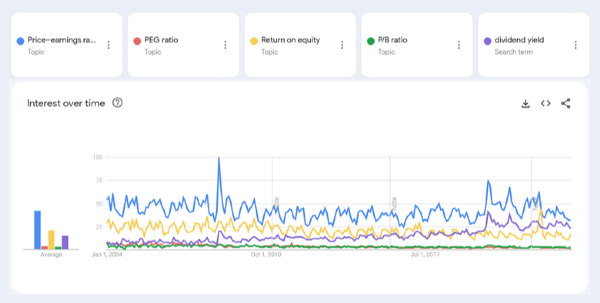
Interestingly, in recent years, dividend yield has outperformed return on equity since 2019. The popularity of valuation metrics will rise and fall with the popularity of value investing.
What is a Good PE ratio for value investing?
A P/E ratio between 6 and 15 may indicate the stock is undervalued. If the P/E ratio is lower, then there is a fundamental problem with the company skewing the results. Higher than 15 may indicate the stock is neutrally priced. When it’s neutrally priced, the stock is near or at its intrinsic value. At these levels the stock will be more volatile and directionless.
How to Use Valuation Ratios
Valuation ratios give a partial view of the stock’s intrinsic value, and they are best used to discover new investment opportunities. Ratios are great for comparing different stocks versus each other, but this comparison only gives you a priority list of stocks to assess. If one stock has a better ratio than another stock, it does not mean it’s a better investment.
The Issues with P/E Ratio
The P/E ratio is notoriously unsuited to use for your investment decisions. The price to earnings ratio completely ignores the balance sheet of a company, its growth, and its sales. Each of these missing pieces is critical to getting a full assessment of the company.
The balance sheet is critical when looking at capital intensive sectors like utilities, industrials and financials. The balance sheet incorporates cash on hand, debt, and capital assets like plants, buildings, and equipment.
The balance sheet gives you a snapshot of what the company has as value during this quarter. If the company was sold into pieces, this is how much money you would get back as an investor.
For example, Boeing (BA) has recently had a book value per share that is negative. That means it essentially doesn’t hold capital and has more debt than assets. Boeing’s price is driven by its earnings, so the price to earnings ratio gives a better snapshot of Boeing’s investment potential.
However, a stock like JP Morgan (JPM) has a recent book value per share of $98.11. This is more than half of JP Morgan’s current price ($149.12 as of September 18th, 2023). It’s why the P/E ratio of JP Morgan will historically be lower than Boeing’s P/E ratio.
JP Morgan has a P/E ratio today of 9.59, while Boeing’s historical P/E ratio (when not negative) stayed steady at around 20. This was due to the market giving Boeing a premium for their earnings growth. A premium that was slashed when Boeing’s earnings went negative in 2019 after their revenue crashed.
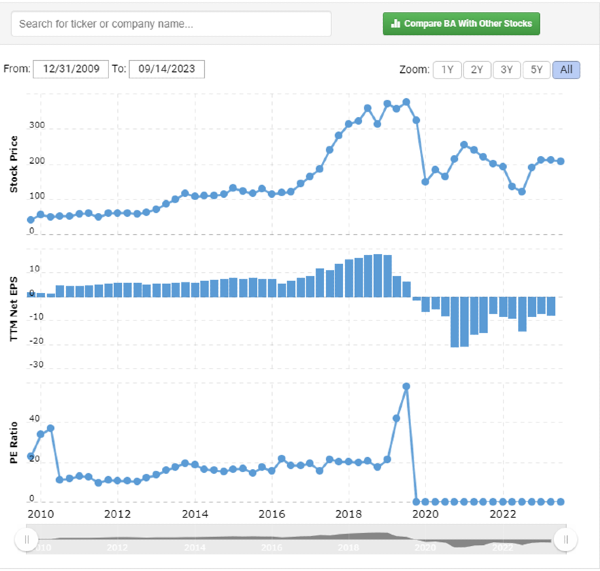
In this example, P/E ratio failed to consider the differences in balance sheets, the crash in revenue, and is completely useless if earnings are negative.
If used with a stock selection guide, you can pair P/E ratio in conjunction with the SSG to come up with a proper valuation.
Issues with Price to book Ratio
The P/B ratio misses a very important ingredient: earnings! The price to book ratio is good for finding stocks whose valuation is out of sync. However, it’s very important to not just make an investment decision because of P/B ratio. Just because a P/B ratio is less than one, it does not mean the company is undervalued.
For a healthy company, if the market prices a company with a P/B ratio less than one, then the market is basically letting you buy stocks in a company that, if it dissolved that day, would still give you a positive investment return.
However, for unhealthy companies, a low P/B ratio indicates that something is broken with the company. Maybe earnings are negative, and management has no realistic plans to turn things around. In this case, the market is pricing in the expectation that book value is going to continue to fall as debt increases and cash is burned.
issues with Dividend Yield
Even dividend yield can be deceiving. Sometimes, the problem is as simple as timing. Maybe a stock once had a great dividend yield, but the board of directors is about to announce a dividend cut. To look out for this problem, you need to analyze the quality of the company before you believe the dividend yield is sustainable.
The Best Ratios to Find Value Investments
There are many methods to find great value stocks. Ratios are a great tool to help siphon out opportunities the market has missed.
Return on Capital with Earnings Yield
From The Little Book that Still Beats the Market, Joel Greenblatt suggest that you rank your stocks based on two metrics:
These are great ratios you can use to find potential value investment opportunities.
P/E Ratio
Okay, after beating up the P/E ratio, we must give the ratio some credit. It is a very good ratio to get a quick view of the stock’s valuation. A negative P/E ratio is an immediate red flag, so is a P/E ratio that is over 100! These are clear signs that something is volatile about the company. The company is not a good value investment opportunity.
Dividend Yield
Again, after bashing dividend yield, we must admit it’s a good way to filter out stock opportunities. Especially if you’re an income generation investor, high dividend yield may be an opportunity to lock in long term dividend gains. Be wary if a stock’s yield is too high versus its peers. The stock’s price may be in perpetual freefall. If it is, it will temporarily skew the dividend yield. If the price drop is correlated with an unhealthy company, then dividend cuts could be in the future.
Be sure to look up the company’s dividend policy. A skewed dividend policy could indicate issues with the company. If the company cannot fulfill its dividend with just earnings, then eventually the dividend will be cut.






What Metrics are used in Value Investing?
Value investing is a strategy that looks to determine if the market has undervalued a stock, and there are many metrics that can help you discover these opportunities.
There are two key categories of metrics that are used in value investing:
What is the Best Valuation Metric?
For stable company’s, calculating the intrinsic value of a stock is the best valuation metric. By discounting earnings per share over a ten year period by the 10 year t-note and adding in the book value per share, you get an intrinsic value of the company. This is similar to the process laid out in Buffetology.
This process is also summarized at bivio.com.
What are the Most Popular Valuation Metrics?
The most popular valuation metric is the P/E ratio. Since 2004, the price to earnings ratio has stood the test of time as the top searched valuation metric. The next most searched topic is return on equity, followed by dividend yield, and in last PEG ratio and price to book ratio.
Source: Google Trends
Interestingly, in recent years, dividend yield has outperformed return on equity since 2019. The popularity of valuation metrics will rise and fall with the popularity of value investing.
What is a Good PE ratio for value investing?
A P/E ratio between 6 and 15 may indicate the stock is undervalued. If the P/E ratio is lower, then there is a fundamental problem with the company skewing the results. Higher than 15 may indicate the stock is neutrally priced. When it’s neutrally priced, the stock is near or at its intrinsic value. At these levels the stock will be more volatile and directionless.
How to Use Valuation Ratios
Valuation ratios give a partial view of the stock’s intrinsic value, and they are best used to discover new investment opportunities. Ratios are great for comparing different stocks versus each other, but this comparison only gives you a priority list of stocks to assess. If one stock has a better ratio than another stock, it does not mean it’s a better investment.
The Issues with P/E Ratio
The P/E ratio is notoriously unsuited to use for your investment decisions. The price to earnings ratio completely ignores the balance sheet of a company, its growth, and its sales. Each of these missing pieces is critical to getting a full assessment of the company.
The balance sheet is critical when looking at capital intensive sectors like utilities, industrials and financials. The balance sheet incorporates cash on hand, debt, and capital assets like plants, buildings, and equipment.
The balance sheet gives you a snapshot of what the company has as value during this quarter. If the company was sold into pieces, this is how much money you would get back as an investor.
For example, Boeing (BA) has recently had a book value per share that is negative. That means it essentially doesn’t hold capital and has more debt than assets. Boeing’s price is driven by its earnings, so the price to earnings ratio gives a better snapshot of Boeing’s investment potential.
However, a stock like JP Morgan (JPM) has a recent book value per share of $98.11. This is more than half of JP Morgan’s current price ($149.12 as of September 18th, 2023). It’s why the P/E ratio of JP Morgan will historically be lower than Boeing’s P/E ratio.
JP Morgan has a P/E ratio today of 9.59, while Boeing’s historical P/E ratio (when not negative) stayed steady at around 20. This was due to the market giving Boeing a premium for their earnings growth. A premium that was slashed when Boeing’s earnings went negative in 2019 after their revenue crashed.
Source: macrotrends.net
In this example, P/E ratio failed to consider the differences in balance sheets, the crash in revenue, and is completely useless if earnings are negative.
If used with a stock selection guide, you can pair P/E ratio in conjunction with the SSG to come up with a proper valuation.
Issues with Price to book Ratio
The P/B ratio misses a very important ingredient: earnings! The price to book ratio is good for finding stocks whose valuation is out of sync. However, it’s very important to not just make an investment decision because of P/B ratio. Just because a P/B ratio is less than one, it does not mean the company is undervalued.
For a healthy company, if the market prices a company with a P/B ratio less than one, then the market is basically letting you buy stocks in a company that, if it dissolved that day, would still give you a positive investment return.
However, for unhealthy companies, a low P/B ratio indicates that something is broken with the company. Maybe earnings are negative, and management has no realistic plans to turn things around. In this case, the market is pricing in the expectation that book value is going to continue to fall as debt increases and cash is burned.
issues with Dividend Yield
Even dividend yield can be deceiving. Sometimes, the problem is as simple as timing. Maybe a stock once had a great dividend yield, but the board of directors is about to announce a dividend cut. To look out for this problem, you need to analyze the quality of the company before you believe the dividend yield is sustainable.
The Best Ratios to Find Value Investments
There are many methods to find great value stocks. Ratios are a great tool to help siphon out opportunities the market has missed.
Return on Capital with Earnings Yield
From The Little Book that Still Beats the Market, Joel Greenblatt suggest that you rank your stocks based on two metrics:
These are great ratios you can use to find potential value investment opportunities.
P/E Ratio
Okay, after beating up the P/E ratio, we must give the ratio some credit. It is a very good ratio to get a quick view of the stock’s valuation. A negative P/E ratio is an immediate red flag, so is a P/E ratio that is over 100! These are clear signs that something is volatile about the company. The company is not a good value investment opportunity.
Dividend Yield
Again, after bashing dividend yield, we must admit it’s a good way to filter out stock opportunities. Especially if you’re an income generation investor, high dividend yield may be an opportunity to lock in long term dividend gains. Be wary if a stock’s yield is too high versus its peers. The stock’s price may be in perpetual freefall. If it is, it will temporarily skew the dividend yield. If the price drop is correlated with an unhealthy company, then dividend cuts could be in the future.
Be sure to look up the company’s dividend policy. A skewed dividend policy could indicate issues with the company. If the company cannot fulfill its dividend with just earnings, then eventually the dividend will be cut.