Are you ready to become a multi-millionaire with Apple? For the last two years, I’ve invested in Apple (AAPL) every single trading day. I started with $20 a day and, after a raise, bumped it up to $60 daily. This simple, repeatable method—called dollar cost averaging—is how I’m on track for an eight-figure nest egg by retirement.
Understanding Dollar Cost Averaging
Dollar cost averaging means investing a fixed amount in a stock—regardless of its price—at consistent intervals. Some days you’ll buy at highs, some days at lows. Over years (not weeks or months), this evens out your average cost. Skip timing the market; let your routine purchases do the work.
Choosing a reliable stock or ETF is key. I picked Apple because I embrace a bit more risk, but this approach works just as well with broad ETFs. History shows that consistently investing without trying to time entries or exits will tide you through market swings and deliver profits over time.
Apple Performance Overview
| Period |
Performance |
| Year to Date |
–6.8% |
| Last 12 Months |
+1% |
| Last 5 Years |
+80% |
Invest Smarter: Join the Movement
If you’re excited to see my entire portfolio, hit thumbs up, subscribe, and tap that new share/recommend button. Your support fuels this channel more than you know.
Inside my Patreon Dream Team, I teach the wheel strategy in small Zoom classes (only three spots left!). You’ll get access to every one of my option courses and join the Lucid Dreamer Roll—seven pro day traders sharing new trades daily. On Sundays, we dive deep in live calls so you can build true passive income.
Apple Stock Analysis: Performance and Portfolio
Apple hasn’t had its best year—down 6.8% YTD—so you might wonder if my daily buys still pay off. Over the last year, Apple is up roughly 1%, but look at five years: an 80% gain, averaging about 15–16% annually. That’s why I chose Apple for DCA—if you’d bought back catalogs, you’d already be a millionaire.
Here’s a snapshot of my Apple holdings:
| Metric |
Value |
| Shares Owned |
176 |
| Average Cost |
$200 |
| Current Price |
$232 |
| Unrealized Gain |
+15.88% |
| Realized Profit |
$5,613 |
| Total Invested |
$30,240 |
Visualizing Dollar Cost Averaging with Charts
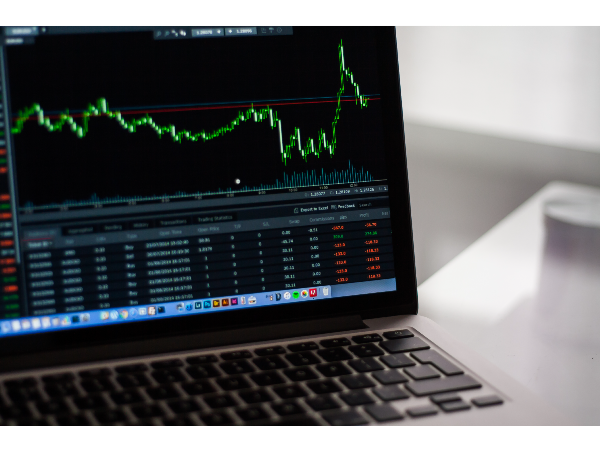
Since I began on August 28, 2023, I’ve sunk $30,240 into AAPL through DCA. Even with this year’s dip, I’m still up 15%. Let me show you why on TradingView—switch to the one-day chart and zoom out to August 2023.
My entry hovered around $175. Imagine a yellow line tracing my average cost as I bought at various prices. On some days, I overpay and underperform AAPL; on others, I snag a bargain and outperform. When Apple hits pullbacks—like dipping below $175—I buy more, boosting my edge over a lump-sum purchase.
Over time, that yellow line climbs steadily, smoothing volatility and compounding gains. You don’t need perfect timing—just a set it and forget it plan with a great company like Apple.
The Power of Consistent Investing
Dollar cost averaging isn’t about predicting market tops and bottoms—it’s about setting a steady habit. You choose your favorite stock or ETF, agree on an amount, and schedule purchases daily, weekly, or monthly. Over decades, those routine buys ride out volatility and harness the market’s upward drift.
By committing to consistent investments, you eliminate guesswork and emotional trading. Whether you set $60 a day, $250 on the first of each month, or $100 every Monday, the principle remains the same: buy regardless of price. This approach levels out your average cost and builds discipline—two pillars of long-term success.
Assumptions for 30-Year Apple Projections
| Assumption |
Value |
| Starting Shares |
176 |
| Daily Investment |
$60 |
| Trading Days per Year |
251 |
| Annual Investment |
$15,060 |
| Dividend Growth Rate |
5.11% |
| Projected Annual Price Gain |
16% |
| Projection Horizon |
30 years |
Projecting Future Returns
Plugging these inputs into a compound-growth model shows how small, steady contributions snowball into multi-million-dollar portfolios. With Apple’s recent 5-year average gain of 16% annually, here are key milestones:
| Year |
Projected Value |
| 1 |
$41,000 |
| 4 |
$100,000 |
| 11 |
$500,000 |
| 15 |
$1,000,000 |
| 20 |
$2,200,000 |
| 22 |
$3,200,000 |
| 24 |
$4,400,000 |
| 26 |
$5,900,000 |
| 30 |
$11,000,000 |
Hitting your first million takes time—about 15 years at this pace. But once you cross that threshold, the compounding effect accelerates. Each extra $1 invested grows more rapidly because it’s building on a much larger base.
By years 29 to 30, you’re adding over $2 million in value annually. That’s not market timing magic—it’s simply letting consistent dollar-cost investing and compound interest work together.
Choosing the Right Stocks for Dollar Cost Averaging
Not every ticker suits a 30-year commitment. Look for companies or ETFs with:
- A long track record of positive annual returns
- Steady dividend growth over decades
- Strong market leadership and competitive moats
Blue-chip names like Apple, Microsoft, or the S&P 500 ETF rarely have prolonged down cycles. Their occasional dips become prime buying opportunities under a DCA plan. If you crave extra risk, sprinkle in smaller-cap growth stocks—but let the blue chips form your portfolio’s backbone.
Join the Dream Team
Ready to streamline your strategy? On my Patreon I teach the wheel and options plays, host Sunday Zoom calls, and share real-time trades with seven pro day traders. Scanning the QR code below or clicking the pinned link in comments gets you inside our tight-knit community.
Down in the comments, tell me: which stocks or ETFs are you dollar-cost averaging? How long have you been at it, and how many shares have you accumulated? Let’s inspire each other.
Make sure you subscribe, hit that thumbs up, and ring the notification bell so you don’t miss part one’s next deep dive on optimizing DCA frequency and blending ETFs with individual names. I’m Zeke, bringing you the dream grain show—peace out!
https://youtu.be/etL2aWpOjpI?si=PHw3m5YtAs2r0Jax


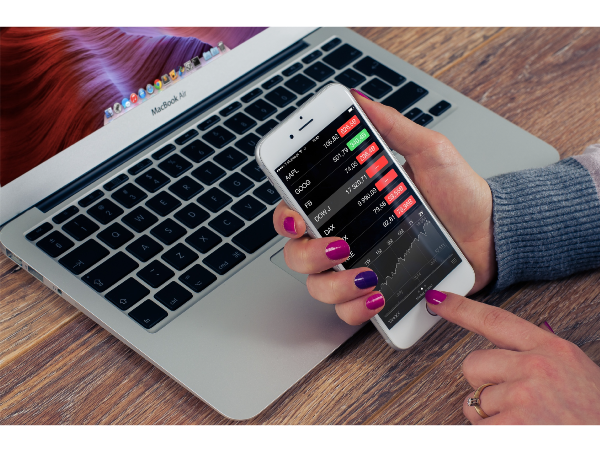


Are you ready to become a multi-millionaire with Apple? For the last two years, I’ve invested in Apple (AAPL) every single trading day. I started with $20 a day and, after a raise, bumped it up to $60 daily. This simple, repeatable method—called dollar cost averaging—is how I’m on track for an eight-figure nest egg by retirement.
Understanding Dollar Cost Averaging
Dollar cost averaging means investing a fixed amount in a stock—regardless of its price—at consistent intervals. Some days you’ll buy at highs, some days at lows. Over years (not weeks or months), this evens out your average cost. Skip timing the market; let your routine purchases do the work.
Choosing a reliable stock or ETF is key. I picked Apple because I embrace a bit more risk, but this approach works just as well with broad ETFs. History shows that consistently investing without trying to time entries or exits will tide you through market swings and deliver profits over time.
Apple Performance Overview
Invest Smarter: Join the Movement
If you’re excited to see my entire portfolio, hit thumbs up, subscribe, and tap that new share/recommend button. Your support fuels this channel more than you know.
Inside my Patreon Dream Team, I teach the wheel strategy in small Zoom classes (only three spots left!). You’ll get access to every one of my option courses and join the Lucid Dreamer Roll—seven pro day traders sharing new trades daily. On Sundays, we dive deep in live calls so you can build true passive income.
Apple Stock Analysis: Performance and Portfolio
Apple hasn’t had its best year—down 6.8% YTD—so you might wonder if my daily buys still pay off. Over the last year, Apple is up roughly 1%, but look at five years: an 80% gain, averaging about 15–16% annually. That’s why I chose Apple for DCA—if you’d bought back catalogs, you’d already be a millionaire.
Here’s a snapshot of my Apple holdings:
Visualizing Dollar Cost Averaging with Charts
Since I began on August 28, 2023, I’ve sunk $30,240 into AAPL through DCA. Even with this year’s dip, I’m still up 15%. Let me show you why on TradingView—switch to the one-day chart and zoom out to August 2023.
My entry hovered around $175. Imagine a yellow line tracing my average cost as I bought at various prices. On some days, I overpay and underperform AAPL; on others, I snag a bargain and outperform. When Apple hits pullbacks—like dipping below $175—I buy more, boosting my edge over a lump-sum purchase.
Over time, that yellow line climbs steadily, smoothing volatility and compounding gains. You don’t need perfect timing—just a set it and forget it plan with a great company like Apple.
The Power of Consistent Investing
Dollar cost averaging isn’t about predicting market tops and bottoms—it’s about setting a steady habit. You choose your favorite stock or ETF, agree on an amount, and schedule purchases daily, weekly, or monthly. Over decades, those routine buys ride out volatility and harness the market’s upward drift.
By committing to consistent investments, you eliminate guesswork and emotional trading. Whether you set $60 a day, $250 on the first of each month, or $100 every Monday, the principle remains the same: buy regardless of price. This approach levels out your average cost and builds discipline—two pillars of long-term success.
Assumptions for 30-Year Apple Projections
Projecting Future Returns
Plugging these inputs into a compound-growth model shows how small, steady contributions snowball into multi-million-dollar portfolios. With Apple’s recent 5-year average gain of 16% annually, here are key milestones:
Hitting your first million takes time—about 15 years at this pace. But once you cross that threshold, the compounding effect accelerates. Each extra $1 invested grows more rapidly because it’s building on a much larger base.
By years 29 to 30, you’re adding over $2 million in value annually. That’s not market timing magic—it’s simply letting consistent dollar-cost investing and compound interest work together.
Choosing the Right Stocks for Dollar Cost Averaging
Not every ticker suits a 30-year commitment. Look for companies or ETFs with:
Blue-chip names like Apple, Microsoft, or the S&P 500 ETF rarely have prolonged down cycles. Their occasional dips become prime buying opportunities under a DCA plan. If you crave extra risk, sprinkle in smaller-cap growth stocks—but let the blue chips form your portfolio’s backbone.
Join the Dream Team
Ready to streamline your strategy? On my Patreon I teach the wheel and options plays, host Sunday Zoom calls, and share real-time trades with seven pro day traders. Scanning the QR code below or clicking the pinned link in comments gets you inside our tight-knit community.
Down in the comments, tell me: which stocks or ETFs are you dollar-cost averaging? How long have you been at it, and how many shares have you accumulated? Let’s inspire each other.
Make sure you subscribe, hit that thumbs up, and ring the notification bell so you don’t miss part one’s next deep dive on optimizing DCA frequency and blending ETFs with individual names. I’m Zeke, bringing you the dream grain show—peace out!
https://youtu.be/etL2aWpOjpI?si=PHw3m5YtAs2r0Jax