Chimp Investor is ranked #3 of 90 by Blog Overview and #10 of 100 by FeedSpot in their relevant categories. A review on WealthTender would be much appreciated.
The outlook for gold in the context of its long-term price trend
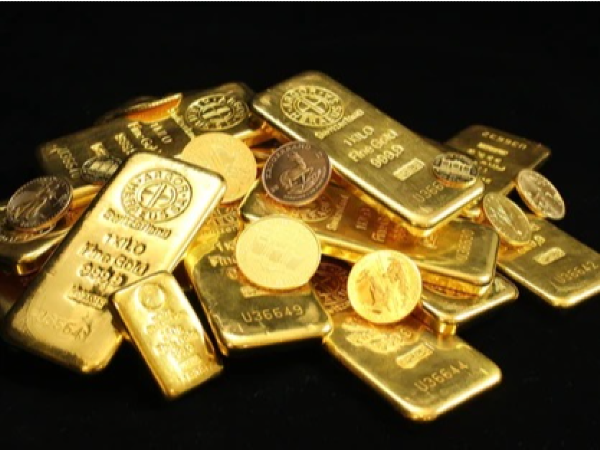
Gold is many things.
Unlike other highly conductive metals such as copper and silver, it neither corrodes nor tarnishes. It is also soft and pliable. As a result of these features, it gets used in electronics.
Additionally, it is beautiful and scarce so was a status symbol long before its application as an industrial metal was established. It is believed to have first been used around 4,000 BCE by a culture in what is now Eastern Europe to fashion decorative objects.
It is heavy - atomic number 79 - so is and has been used as a store of value, whether in the form of coins or bars. In the latter form it has been used to back fiat currencies – until 1971 the US government promised to exchange a one-dollar bill for 1/35th ounces of gold.
In view of the nature of its price behaviour, it is considered to varying degress and at different times an inflation hedge, an investment, a safe haven.
Owners of gold may not in fact own as much as they think they do. Gold coins were often melted down by unscrupulous operators and reconstituted with lead. The US government did not have sufficient gold in its vaults to fulfill its earlier mentioned promise and had to renege on it in 1971. Today, many holders of gold ETFs or certificates do not have the access rights to the underlying physical metal they may think they do.
Producers also complicate the picture. Changes in gold mining companies' forward selling policies can significantly influence the price. Extraction costs are determined by many factors, not least energy prices. Marginal cost producers may have to close mines when the gold price falls thus reducing the supply.
And on, and on. Is it any wonder that it is so hard to predict the gold price?
Indeed, this post is not even going to attempt to appraise these drivers, the so-called fundamentals. It is simply going to look at the long-term price of gold in nominal and inflation-adjusted terms, the so-called technicals, to see if there is anything that can be learned.
Chart 1 below is of the gold price in nominal (US$) terms since 1791. The key point to note is that until 1971 the gold price was fixed, at around $20 per ounce (excepting the American Civil War years) until 1934, then at $35 per ounce until 1971. Only since 1971 has the gold price been subject to market forces.
The dotted line is the exponential trend line which is meaningless for two reasons. First, for most of the 230 or so years the gold price was fixed. Second, the prices are not adjusted for inflation. Comparing the price today of say, a bushel of wheat, with that 500 years ago is only meaningful if the change in purchasing power - inflation - in the intervening period is accounted for.
(Note: a semilog scale is a chart in which one scale/axis is logarithmic - in the below charts the vertical one - the other linear. In a log-log chart both are logarithmic. Logarithmic scales themselves are ones that allow for an increase in the unit in question from, say, 1,000 to 2,000 to have the visual representation in the chart as one from 10 to 20. This is as it should be; it is the percentage change that is relevant, not the price change.)

Source: measuringworth.com
Chart 2 below is the same as chart 1 other than that the prices are adjusted for inflation i.e. purchasing power. The trend line is appended but, again, because the gold price was fixed for most of the 230 years, it is meaningless.

Source: measuringworth.com
Chart 3 below highlights the period in which the gold price has been driven by market forces. It should be clear that the trend line is now more meaningful.

Source: measuringworth.com
Chart 4 below is only of the period since 1971, allowing us to discern more clearly the price movement and its trend during that time.
There have really only been four periods of distinct price performance.
The first was the 1970s when the inflation-adjusted gold price rose around 600%. The second was from the early 80s to the early noughties during which the inflation-adjusted gold price fell around 80%. These two periods were ones, respectively, when inflation was rising and falling, and arguably gave gold its reputation as an inflation hedge.
The third was from around 2001 to 2012 which saw the real gold price rise sharply. Finally, the last ten or so years have seen the gold price essentially go nowhere, even if there were short term periods when the price movement may have felt significant, from 2012 to 2015 for example.

Source: measuringworth.com
What can be inferred/learned from these charts, particularly the last one?
First, the trend line over the last 50 years represents an increase in the inflation adjusted gold price of 1.7% per annum. This can be more than justified on the basis that global real wealth has increased at a much higher rate than that over the 50 or so years. Thus, I do not think it is unreasonable to expect this trend to continue.
Second, we are currently slightly above long-term trend which would imply a prospective long term real price appreciation of perhaps 1.5% per annum i.e. slightly less than trend of 1.7%.
Third, there have been two moments when the real price was around 50-60% below long term trend. It is therefore not out of the question, from a purely statistical perspective, that this could happen to the real gold price again in the next few years before it bounces back to trend, then perhaps above it. It is also possible that instead of heading below trend in the next few years it bounces back above it from current levels. The volatility, in combination with the fact that we are currently neither way above nor below trend, is such that one cannot say much beyond this. Sorry!
Of course, the fact that the fundamental drivers of the gold price as mentioned earlier are complex should not preclude an appraisal of them. One for a later post.
It should of course be noted that were the real gold price to head below trend in the next few years, as noted above as a possibility, this might still equate to a real return that is better - less negative - than those from other asset classes, cash included.
Perhaps gold is still precious.
The views expressed in this communication are those of Peter Elston at the time of writing and are subject to change without notice. They do not constitute investment advice and whilst all reasonable efforts have been used to ensure the accuracy of the information contained in this communication, the reliability, completeness or accuracy of the content cannot be guaranteed. This communication provides information for professional use only and should not be relied upon by retail investors as the sole basis for investment.










Chimp Investor is ranked #3 of 90 by Blog Overview and #10 of 100 by FeedSpot in their relevant categories. A review on WealthTender would be much appreciated.
The outlook for gold in the context of its long-term price trend
Gold is many things.
Unlike other highly conductive metals such as copper and silver, it neither corrodes nor tarnishes. It is also soft and pliable. As a result of these features, it gets used in electronics.
Additionally, it is beautiful and scarce so was a status symbol long before its application as an industrial metal was established. It is believed to have first been used around 4,000 BCE by a culture in what is now Eastern Europe to fashion decorative objects.
It is heavy - atomic number 79 - so is and has been used as a store of value, whether in the form of coins or bars. In the latter form it has been used to back fiat currencies – until 1971 the US government promised to exchange a one-dollar bill for 1/35th ounces of gold.
In view of the nature of its price behaviour, it is considered to varying degress and at different times an inflation hedge, an investment, a safe haven.
Owners of gold may not in fact own as much as they think they do. Gold coins were often melted down by unscrupulous operators and reconstituted with lead. The US government did not have sufficient gold in its vaults to fulfill its earlier mentioned promise and had to renege on it in 1971. Today, many holders of gold ETFs or certificates do not have the access rights to the underlying physical metal they may think they do.
Producers also complicate the picture. Changes in gold mining companies' forward selling policies can significantly influence the price. Extraction costs are determined by many factors, not least energy prices. Marginal cost producers may have to close mines when the gold price falls thus reducing the supply.
And on, and on. Is it any wonder that it is so hard to predict the gold price?
Indeed, this post is not even going to attempt to appraise these drivers, the so-called fundamentals. It is simply going to look at the long-term price of gold in nominal and inflation-adjusted terms, the so-called technicals, to see if there is anything that can be learned.
Chart 1 below is of the gold price in nominal (US$) terms since 1791. The key point to note is that until 1971 the gold price was fixed, at around $20 per ounce (excepting the American Civil War years) until 1934, then at $35 per ounce until 1971. Only since 1971 has the gold price been subject to market forces.
The dotted line is the exponential trend line which is meaningless for two reasons. First, for most of the 230 or so years the gold price was fixed. Second, the prices are not adjusted for inflation. Comparing the price today of say, a bushel of wheat, with that 500 years ago is only meaningful if the change in purchasing power - inflation - in the intervening period is accounted for.
(Note: a semilog scale is a chart in which one scale/axis is logarithmic - in the below charts the vertical one - the other linear. In a log-log chart both are logarithmic. Logarithmic scales themselves are ones that allow for an increase in the unit in question from, say, 1,000 to 2,000 to have the visual representation in the chart as one from 10 to 20. This is as it should be; it is the percentage change that is relevant, not the price change.)
Source: measuringworth.com
Chart 2 below is the same as chart 1 other than that the prices are adjusted for inflation i.e. purchasing power. The trend line is appended but, again, because the gold price was fixed for most of the 230 years, it is meaningless.
Source: measuringworth.com
Chart 3 below highlights the period in which the gold price has been driven by market forces. It should be clear that the trend line is now more meaningful.
Source: measuringworth.com
Chart 4 below is only of the period since 1971, allowing us to discern more clearly the price movement and its trend during that time.
There have really only been four periods of distinct price performance.
The first was the 1970s when the inflation-adjusted gold price rose around 600%. The second was from the early 80s to the early noughties during which the inflation-adjusted gold price fell around 80%. These two periods were ones, respectively, when inflation was rising and falling, and arguably gave gold its reputation as an inflation hedge.
The third was from around 2001 to 2012 which saw the real gold price rise sharply. Finally, the last ten or so years have seen the gold price essentially go nowhere, even if there were short term periods when the price movement may have felt significant, from 2012 to 2015 for example.
Source: measuringworth.com
What can be inferred/learned from these charts, particularly the last one?
First, the trend line over the last 50 years represents an increase in the inflation adjusted gold price of 1.7% per annum. This can be more than justified on the basis that global real wealth has increased at a much higher rate than that over the 50 or so years. Thus, I do not think it is unreasonable to expect this trend to continue.
Second, we are currently slightly above long-term trend which would imply a prospective long term real price appreciation of perhaps 1.5% per annum i.e. slightly less than trend of 1.7%.
Third, there have been two moments when the real price was around 50-60% below long term trend. It is therefore not out of the question, from a purely statistical perspective, that this could happen to the real gold price again in the next few years before it bounces back to trend, then perhaps above it. It is also possible that instead of heading below trend in the next few years it bounces back above it from current levels. The volatility, in combination with the fact that we are currently neither way above nor below trend, is such that one cannot say much beyond this. Sorry!
Of course, the fact that the fundamental drivers of the gold price as mentioned earlier are complex should not preclude an appraisal of them. One for a later post.
It should of course be noted that were the real gold price to head below trend in the next few years, as noted above as a possibility, this might still equate to a real return that is better - less negative - than those from other asset classes, cash included.
Perhaps gold is still precious.
The views expressed in this communication are those of Peter Elston at the time of writing and are subject to change without notice. They do not constitute investment advice and whilst all reasonable efforts have been used to ensure the accuracy of the information contained in this communication, the reliability, completeness or accuracy of the content cannot be guaranteed. This communication provides information for professional use only and should not be relied upon by retail investors as the sole basis for investment.
Originally Posted on chimpinvestor.com