This is a company I genuinely enjoy researching. Toast is doing all the right things to grow, expand its stock price, and strengthen its fundamentals. With financials like these, who wouldn’t want to take a closer look? In this first half of our analysis, we’ll explore Toast’s business model, financials, and balance sheet strength. In the second half, we’ll move into valuation, DCF, and compounder scoring.
Understanding Toast’s Business Model
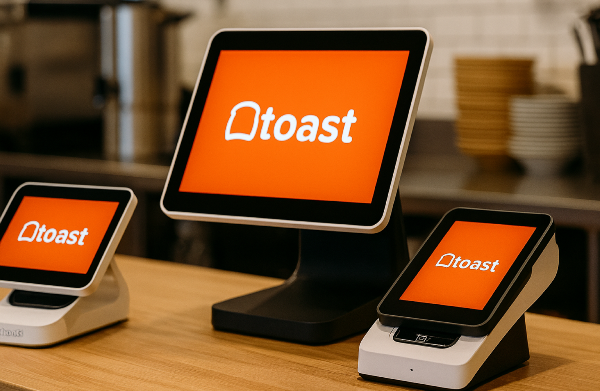
Toast is a fairly simple business to understand. They provide point-of-sale (POS) systems—those terminals you see at restaurants or stores that allow credit card payments. What makes Toast stand out is how customizable their offering is.
They’ve expanded beyond restaurants into convenience stores, bottle shops, butcher shops, groceries, and more. This ambition has fueled their growth and positioned them as a leader in POS solutions.
Here’s how it works:
- Restaurants subscribe to one of Toast’s plans.
- They receive proprietary devices such as Toast Flex or kitchen display systems.
- A dedicated agent helps set up credentials, menus, and integrations.
- The system connects ordering, payments, kitchen operations, loyalty programs, and even third-party apps like Uber Eats and DoorDash.
Toast uses a land-and-expand model. Their starter kit is free, but the payment processing fees (take rate) are higher than usual. This allows small businesses to adopt Toast easily, then scale with it as they grow. The more money restaurants earn, the more Toast earns too.
Financial Performance
The easiest way to analyze a business is through its financials, and Toast’s numbers speak volumes. Revenue and net income have been growing rapidly. In the last 12 months, Toast crossed $6 billion in full-year revenue.
Margins have also improved dramatically. In 2019, Toast had a negative net margin of -31%. Today, they’ve expanded to a positive 5% margin. This turnaround is driven by two key initiatives:
- Rapid growth and international expansion, which boosts operating leverage.
- Cost discipline, with reductions in SG&A, R&D, and sales/marketing budgets.
Revenue and Margin Expansion
| Year |
Revenue |
Net Margin |
| 2019 |
N/A |
-31% |
| 2024 (TTM) |
$6B+ |
5% |
Balance Sheet Strength
Generating income is critical, but a company must also manage debt. Bankruptcy risk arises when businesses can’t cover liabilities. Toast, however, is in a strong position.
With cash and cash equivalents alone, Toast can cover all short-term liabilities, currently estimated at $900 million. This liquidity gives them flexibility to handle unexpected challenges, pursue share buybacks, or make strategic acquisitions.
Asset-Light Advantage and Free Cash Flow
One of Toast’s biggest strengths is being an asset-light business. Their software is already developed, requiring minimal capital expenditures. This means most net income flows directly into free cash flow.
Quarterly free cash flow is both predictable and stable, clustering around a median of $120 million. The last two quarters have exceeded this median thanks to growth momentum. For investors, this kind of consistency is exactly what you want to see.
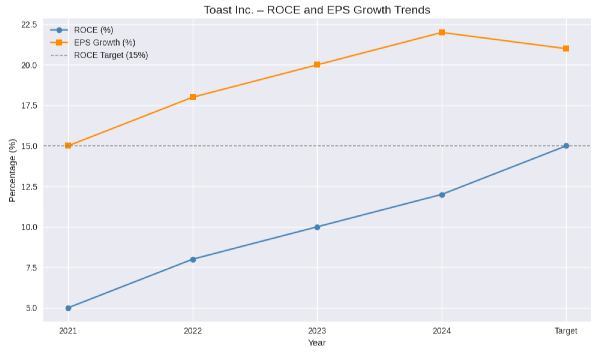
Return on Capital Employed (ROCE)
One of the key criteria for long-term compounders is a sustainable return on capital employed (ROCE) above 15%. Toast isn’t there yet, but the trajectory is promising.
- Current ROCE: ~12% (last 12 months)
- Threshold for compounders: 15%
- Outlook: With margins expanding, Toast is expected to cross the threshold within a few quarters.
ROCE Progression
Shares Outstanding and Dilution
Rapidly growing tech companies often face equity dilution due to stock-based compensation. Toast’s shares outstanding have increased at 3–5% annually since 2021. While dilution reduces ownership percentages, the company’s EPS growth of 20%+ per year offsets this concern.
- Shares outstanding growth: 3–5% annually
- EPS growth: 20%+ annually
- Net effect: Dilution manageable if EPS growth continues
Competitive Advantage
Toast’s moat is built on two pillars:
- High switching costs – Proprietary hardware locks restaurants into Toast’s ecosystem. Switching to competitors like Square or Clover requires new hardware and operational downtime.
- Emerging network effects – Toast collects unique, non-public data from thousands of restaurants, including menu trends, pricing benchmarks, and workforce ratios. This data creates insights competitors cannot replicate.
Competitive Landscape
| Competitor Type |
Example |
Strength |
Weakness vs. Toast |
| Legacy |
Fiserv |
Established systems |
Less innovation |
| Niche |
Inventory or table apps |
Specialized features |
No all-in-one platform |
| Direct |
Square, Clover |
Scale, flexible fees |
Less restaurant focus |
Valuation and Cyclicality
Toast’s valuation metrics highlight both opportunity and caution:
- Free cash flow yield: 2.7% (approaching attractive levels at 3%)
- Forward P/E: Lowest since Jan 2024
- DCF projection: ~20% annual return if assumptions hold
However, Toast operates in a cyclical industry. Economic downturns reduce restaurant revenues, which directly impacts Toast’s payment processing fees and onboarding growth.
Valuation Snapshot
| Metric |
Current Value |
Implication |
| FCF Yield |
2.7% |
Near attractive threshold |
| Forward P/E |
Lowest since Jan 2024 |
Market uncertainty |
| DCF Return |
~20% annually |
Strong upside if assumptions hold |
Final Verdict – Buy, Hold, or Sell?
Toast is a young but fundamentally strong company. Its balance sheet is liquid, free cash flow is stable, and competitive advantages are widening. Risks remain in dilution, competition from larger players, and industry cyclicality. Yet, with margins improving and valuation metrics pointing toward upside, Toast presents a compelling case.
Verdict: Buy (short to mid-term) – The fundamentals, growth trajectory, and potential returns outweigh the risks, making Toast an attractive investment at current levels.
https://youtu.be/Go2rVKpZ4M8?si=hJbgAKU2_5jnmX1k


This is a company I genuinely enjoy researching. Toast is doing all the right things to grow, expand its stock price, and strengthen its fundamentals. With financials like these, who wouldn’t want to take a closer look? In this first half of our analysis, we’ll explore Toast’s business model, financials, and balance sheet strength. In the second half, we’ll move into valuation, DCF, and compounder scoring.
Understanding Toast’s Business Model
Toast is a fairly simple business to understand. They provide point-of-sale (POS) systems—those terminals you see at restaurants or stores that allow credit card payments. What makes Toast stand out is how customizable their offering is.
They’ve expanded beyond restaurants into convenience stores, bottle shops, butcher shops, groceries, and more. This ambition has fueled their growth and positioned them as a leader in POS solutions.
Here’s how it works:
Toast uses a land-and-expand model. Their starter kit is free, but the payment processing fees (take rate) are higher than usual. This allows small businesses to adopt Toast easily, then scale with it as they grow. The more money restaurants earn, the more Toast earns too.
Financial Performance
The easiest way to analyze a business is through its financials, and Toast’s numbers speak volumes. Revenue and net income have been growing rapidly. In the last 12 months, Toast crossed $6 billion in full-year revenue.
Margins have also improved dramatically. In 2019, Toast had a negative net margin of -31%. Today, they’ve expanded to a positive 5% margin. This turnaround is driven by two key initiatives:
Revenue and Margin Expansion
Balance Sheet Strength
Generating income is critical, but a company must also manage debt. Bankruptcy risk arises when businesses can’t cover liabilities. Toast, however, is in a strong position.
With cash and cash equivalents alone, Toast can cover all short-term liabilities, currently estimated at $900 million. This liquidity gives them flexibility to handle unexpected challenges, pursue share buybacks, or make strategic acquisitions.
Asset-Light Advantage and Free Cash Flow
One of Toast’s biggest strengths is being an asset-light business. Their software is already developed, requiring minimal capital expenditures. This means most net income flows directly into free cash flow.
Quarterly free cash flow is both predictable and stable, clustering around a median of $120 million. The last two quarters have exceeded this median thanks to growth momentum. For investors, this kind of consistency is exactly what you want to see.
Return on Capital Employed (ROCE)
One of the key criteria for long-term compounders is a sustainable return on capital employed (ROCE) above 15%. Toast isn’t there yet, but the trajectory is promising.
ROCE Progression
Shares Outstanding and Dilution
Rapidly growing tech companies often face equity dilution due to stock-based compensation. Toast’s shares outstanding have increased at 3–5% annually since 2021. While dilution reduces ownership percentages, the company’s EPS growth of 20%+ per year offsets this concern.
Competitive Advantage
Toast’s moat is built on two pillars:
Competitive Landscape
Valuation and Cyclicality
Toast’s valuation metrics highlight both opportunity and caution:
However, Toast operates in a cyclical industry. Economic downturns reduce restaurant revenues, which directly impacts Toast’s payment processing fees and onboarding growth.
Valuation Snapshot
Final Verdict – Buy, Hold, or Sell?
Toast is a young but fundamentally strong company. Its balance sheet is liquid, free cash flow is stable, and competitive advantages are widening. Risks remain in dilution, competition from larger players, and industry cyclicality. Yet, with margins improving and valuation metrics pointing toward upside, Toast presents a compelling case.
Verdict: Buy (short to mid-term) – The fundamentals, growth trajectory, and potential returns outweigh the risks, making Toast an attractive investment at current levels.
https://youtu.be/Go2rVKpZ4M8?si=hJbgAKU2_5jnmX1k