The Top Stocks Analyzed Using the Stock Selection Guide (SSG)
Check out this companion video on the Stock Selection Guide and BetterInvesting™:
https://www.youtube.com/watch?v=GvAMzpLt7MQ&t=2s
If you would to like to try out the Stock Selection Guide strategy, check out this 90 day BetterInvesting™ free trial offer:
The Top Stock Selection Guide Ideas
The list of stock ideas above are generated by the top investors on the StockBossUp platform. These stock ideas were generated using a stock selection guide to conduct the analysis.
Read More: How to Get Your Stock Analysis on this Page
What is the Stock Selection Guide?
The stock selection guide (SSG) is an investing methodology developed by BetterInvesting™. The SSG looks to find a stock that is undervalued and has proven growth that can continue into the future.
The Stock Selection Guide for New Investors
The SSG is a great tool for new investors to learn the fundamentals of assessing a company so that they can profitably invest in stocks. Before new investors use the SSG, they should get familiar with basic investment terms and data sources.
Read More: What is a Stock Selection Guide - an Explanation for New Investors
How to Use the Stock Selection Guide
The stock selection guide can be used to determine if a stock is a good buy or if it needs to be sold. It is also a useful tool when managing your portfolio holistically.
The stock selection guide follow these steps:
- Do you trust management? The first step is to determine if you can trust management to grow this business. Do they have the knowledge, dedication, and leadership strength to continue growth?
- Determine if the company's sales are trending upward. Create your own educated assessment of sales growth based on these trends.
- Determine the profitability trends of the company. The profitability of the company should be growing along with the company's sales.
A stock selection guide uses a logarithmic scaled graph to plot the company's sales, profit, and price. This allows exponential growth to be viewed as a straight line. For visual learners, a good SSG chart will have sales and profit lines that are trending upward, straight, and parallel.
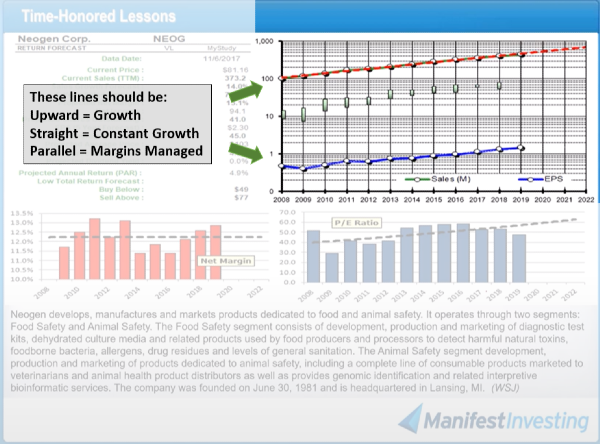
- Upwards - The lines should have an upwards slope. This indicates increasing growth over time.
- Straight - Thanks to the logarithmic y-axis, a straight line indicates exponential growth
- Parallel - profitability is growing with revenue. This means the company is managing its margins.
Read More: How to Analyze Stocks Using a Stock Selection Guide
Further Resources
If you would to like to try out the Stock Selection Guide strategy, check out this 90 day BetterInvesting™ free trial offer:
Check out this companion video on the Stock Selection Guide and BetterInvesting™: