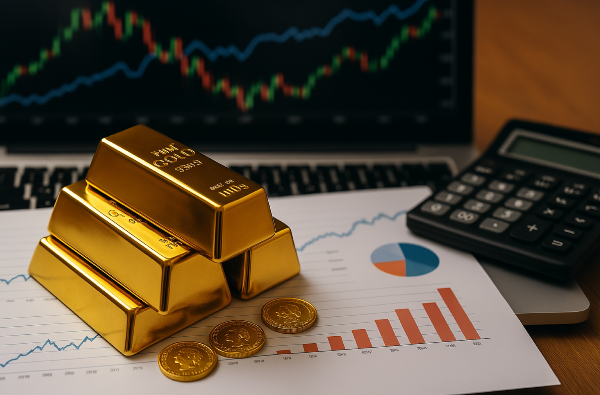
Below is the dividend yield, payout ratio, and dividend growth for Barrick Gold and other gold related dividend companies.
When evaluating gold stocks, dividends can be a game-changer for investors seeking both stability and income. Barrick Gold Corporation (NYSE: GOLD), one of the world's leading gold miners, has long been a focal point for dividend-focused portfolios. But how does Barrick Gold stack up in the world of precious metal dividends?
In this guide, we'll explore Barrick Gold’s dividend policies, historical payouts, and what investors should consider when assessing its yield. Whether you're looking to add a reliable income stream to your portfolio or simply weighing the pros and cons of gold stocks that pay dividends, this article will provide the insights you need to make informed decisions.
Let's dive into Barrick Gold’s financial standing and discover whether its dividend strategy aligns with your investment goals.
Understanding Barrick Gold's Dividend Policy
Barrick Gold has maintained a steady dividend payout over the years, reflecting its commitment to shareholder returns. Historically, the company has adjusted its dividend based on gold price fluctuations and overall financial performance. As of May 2025, Barrick Gold offers an annual dividend of $0.40 per share, translating to a 2.12% yield. While this yield is lower than some high-dividend stocks, it remains competitive within the gold mining sector, particularly given Barrick’s focus on operational efficiency and cost management.
The company’s financial health plays a crucial role in determining dividend payouts. Barrick Gold maintains a dividend payout ratio of 30.08%, ensuring that dividends remain sustainable while allowing for reinvestment in growth initiatives. The firm’s strong balance sheet, with controlled debt levels and consistent free cash flow, supports its ability to distribute dividends even during periods of market volatility. Investors should consider Barrick’s ability to generate stable earnings, as this directly impacts future dividend adjustments.
Compared to other gold miners, Barrick Gold’s dividend yield is relatively moderate. Newmont Corporation (NYSE: NEM), for instance, offers a higher annual dividend of $1.00 per share but with a slightly lower yield of 1.9%. Meanwhile, Agnico Eagle Mines and Franco-Nevada provide dividends with varying payout ratios, reflecting different strategies in capital allocation. Barrick’s approach balances dividend payments with reinvestment, making it a solid choice for investors seeking both income and long-term growth potential.
Barrick Gold's Dividend Performance in 2025
Barrick Gold’s dividend yield for 2025 stands at 2.12%, with an annual dividend of $0.40 per share. This yield remains competitive within the gold mining sector, balancing shareholder returns with reinvestment in growth initiatives. Investors looking for steady income from gold stocks will find Barrick’s dividend policy appealing, especially given its historical commitment to maintaining payouts.
The company continues its quarterly dividend payments, with the most recent payout of $0.10 per share scheduled for June 16, 2025. This follows previous quarterly distributions of the same amount in March, December, and September 2024, demonstrating consistency in its dividend strategy Dividend Yield. Barrick has also engaged in share repurchases, reinforcing its commitment to shareholder value.
Over the past five years, Barrick Gold’s dividend growth rate has averaged 7.39% per year. While this growth rate is moderate compared to some high-yield dividend stocks, it reflects Barrick’s strategic approach to balancing payouts with operational investments. Investors should consider this steady growth when evaluating Barrick’s long-term dividend sustainability.
Factors Affecting Barrick Gold’s Dividends
Barrick Gold’s dividend yield for 2025 stands at 2.12%, with an annual dividend of $0.40 per share. This yield remains competitive within the gold mining sector, balancing shareholder returns with reinvestment in growth initiatives. Investors looking for steady income from gold stocks will find Barrick’s dividend policy appealing, especially given its historical commitment to maintaining payouts.
The company continues its quarterly dividend payments, with the most recent payout of $0.10 per share scheduled for June 16, 2025. This follows previous quarterly distributions of the same amount in March, December, and September 2024, demonstrating consistency in its dividend strategy. Barrick has also engaged in share repurchases, reinforcing its commitment to shareholder value.
Over the past five years, Barrick Gold’s dividend growth rate has averaged 7.39% per year. While this growth rate is moderate compared to some high-yield dividend stocks, it reflects Barrick’s strategic approach to balancing payouts with operational investments. Investors should consider this steady growth when evaluating Barrick’s long-term dividend sustainability.
5. How Barrick Gold Compares to Other Dividend-Paying Gold Stocks
Barrick Gold’s dividend yield of 2.12% positions it competitively among gold stocks, but how does it compare to other major players? Newmont Corporation (NYSE: NEM) offers a 1.97% yield, with an annual dividend of $1.00 per share, paid quarterly. While Newmont has historically maintained stable dividends, its payout ratio of 22.53% suggests a conservative approach to shareholder returns.
Franco-Nevada Corporation (NYSE: FNV) operates under a royalty model, providing a 0.92% dividend yield with an annual payout of $1.52 per share. While its yield is lower than Barrick’s, Franco-Nevada’s 52.97% payout ratio reflects its commitment to returning capital to investors while maintaining financial flexibility Dividend History, Dates & Yield - Stock Analysis](https://stockanalysis.com/stocks/fnv/dividend/).
Wheaton Precious Metals Corp. (NYSE: WPM) follows a streaming model, ensuring dividend sustainability through long-term agreements. The company recently increased its quarterly dividend to $0.165 per share, marking a 6.5% growth from 2024. Meanwhile, Agnico Eagle Mines Limited (NYSE: AEM) maintains a 1.5% dividend yield, balancing consistency with reinvestment. Compared to Barrick, Agnico Eagle’s dividend strategy emphasizes long-term stability, making it a strong contender for income-focused investors.
More Information: investor relations of each competitor:
These links will take you directly to their latest financial reports, dividend policies, and shareholder updates. Let me know if you need any further refinements!
Risks Associated with Barrick Gold’s Dividends
Barrick Gold’s dividend payouts are heavily influenced by commodity price fluctuations. Gold prices have historically been volatile, driven by macroeconomic factors such as inflation, interest rates, and geopolitical uncertainty. In 2025, gold prices peaked at $3,500 per ounce before retreating due to easing U.S.-China tariffs. This volatility can impact Barrick’s revenue, potentially leading to dividend reductions during downturns.
Operational risks also play a significant role in Barrick’s dividend sustainability. The company’s profitability depends on efficient mining operations, cost management, and production stability. While Barrick has maintained strong cash flow and a 30.08% dividend payout ratio, unexpected disruptions—such as equipment failures or labor disputes—could strain financial performance and affect dividend consistency.
Geopolitical risks further complicate Barrick’s dividend outlook. The company operates mines in politically unstable regions, including Mali, where government disputes have led to gold export blockades and workforce layoffs. Such conflicts can disrupt production, reduce revenue, and ultimately impact dividend payouts. Investors should monitor Barrick’s exposure to geopolitical risks when assessing dividend reliability.
Opportunities for Dividend Investors
Evaluating Barrick Gold’s dividend strength requires analyzing key financial metrics. Investors should consider the dividend payout ratio (30.08%), historical dividend growth (7.39% annually), and free cash flow trends. A sustainable payout ratio ensures dividends remain stable while allowing for reinvestment in growth initiatives.
Strategic investing in dividend-paying gold stocks involves diversification and timing. Investors can balance their portfolios by including royalty companies like Franco-Nevada (NYSE: FNV), which offer consistent dividends with lower operational risks. Additionally, monitoring gold price cycles can help investors capitalize on dividend increases during bullish markets.
Long-term vs. short-term dividend investors should weigh different considerations. Long-term investors benefit from compounding returns and dividend reinvestment, making Barrick’s steady payout attractive. Short-term investors, on the other hand, may seek higher-yield gold stocks or trade based on gold price movements. Understanding these dynamics helps investors align their strategies with financial goals.
Conclusion
Barrick Gold’s dividend strategy is more than just numbers—it's a balancing act between stability, market trends, and long-term sustainability. As we've seen, it’s competitive within the gold sector, but it’s not without risks. Price fluctuations, geopolitical uncertainties, and operational challenges are all factors investors need to weigh. Still, for those focused on dividend growth and compounding returns, Barrick offers a solid foundation.
The real takeaway? Investing in gold dividends isn’t just about chasing yield—it's about understanding the why behind the payouts. Whether you're optimizing a long-term portfolio or looking for strategic entry points, knowing how companies like Barrick compare to competitors can be a game-changer. Keep an eye on payout ratios, market conditions, and reinvestment strategies, and you’ll be positioning yourself for smarter investment decisions.
Material Stocks Quick Find List 🚀
Discover more about the material sector with our collection of in depth market exploration and and hot investment topics.
General 🌟
Construction Stocks 🏗️
Lumber Stocks 🌲
International Material Stocks 🌍
Metal Stocks ⚙️
Aluminum Stocks ✨
Steel Stocks 💪
Precious Metal Stocks 💎
Material Stocks with Dividends 🎯
Industrial Gas Stocks 🚀
Rare Earth Stocks 🌐
Advanced Materials 🔬


Below is the dividend yield, payout ratio, and dividend growth for Barrick Gold and other gold related dividend companies.
When evaluating gold stocks, dividends can be a game-changer for investors seeking both stability and income. Barrick Gold Corporation (NYSE: GOLD), one of the world's leading gold miners, has long been a focal point for dividend-focused portfolios. But how does Barrick Gold stack up in the world of precious metal dividends?
In this guide, we'll explore Barrick Gold’s dividend policies, historical payouts, and what investors should consider when assessing its yield. Whether you're looking to add a reliable income stream to your portfolio or simply weighing the pros and cons of gold stocks that pay dividends, this article will provide the insights you need to make informed decisions.
Let's dive into Barrick Gold’s financial standing and discover whether its dividend strategy aligns with your investment goals.
Understanding Barrick Gold's Dividend Policy
Barrick Gold has maintained a steady dividend payout over the years, reflecting its commitment to shareholder returns. Historically, the company has adjusted its dividend based on gold price fluctuations and overall financial performance. As of May 2025, Barrick Gold offers an annual dividend of $0.40 per share, translating to a 2.12% yield. While this yield is lower than some high-dividend stocks, it remains competitive within the gold mining sector, particularly given Barrick’s focus on operational efficiency and cost management.
The company’s financial health plays a crucial role in determining dividend payouts. Barrick Gold maintains a dividend payout ratio of 30.08%, ensuring that dividends remain sustainable while allowing for reinvestment in growth initiatives. The firm’s strong balance sheet, with controlled debt levels and consistent free cash flow, supports its ability to distribute dividends even during periods of market volatility. Investors should consider Barrick’s ability to generate stable earnings, as this directly impacts future dividend adjustments.
Compared to other gold miners, Barrick Gold’s dividend yield is relatively moderate. Newmont Corporation (NYSE: NEM), for instance, offers a higher annual dividend of $1.00 per share but with a slightly lower yield of 1.9%. Meanwhile, Agnico Eagle Mines and Franco-Nevada provide dividends with varying payout ratios, reflecting different strategies in capital allocation. Barrick’s approach balances dividend payments with reinvestment, making it a solid choice for investors seeking both income and long-term growth potential.
Barrick Gold's Dividend Performance in 2025
Barrick Gold’s dividend yield for 2025 stands at 2.12%, with an annual dividend of $0.40 per share. This yield remains competitive within the gold mining sector, balancing shareholder returns with reinvestment in growth initiatives. Investors looking for steady income from gold stocks will find Barrick’s dividend policy appealing, especially given its historical commitment to maintaining payouts.
The company continues its quarterly dividend payments, with the most recent payout of $0.10 per share scheduled for June 16, 2025. This follows previous quarterly distributions of the same amount in March, December, and September 2024, demonstrating consistency in its dividend strategy Dividend Yield. Barrick has also engaged in share repurchases, reinforcing its commitment to shareholder value.
Over the past five years, Barrick Gold’s dividend growth rate has averaged 7.39% per year. While this growth rate is moderate compared to some high-yield dividend stocks, it reflects Barrick’s strategic approach to balancing payouts with operational investments. Investors should consider this steady growth when evaluating Barrick’s long-term dividend sustainability.
Factors Affecting Barrick Gold’s Dividends
Barrick Gold’s dividend yield for 2025 stands at 2.12%, with an annual dividend of $0.40 per share. This yield remains competitive within the gold mining sector, balancing shareholder returns with reinvestment in growth initiatives. Investors looking for steady income from gold stocks will find Barrick’s dividend policy appealing, especially given its historical commitment to maintaining payouts.
The company continues its quarterly dividend payments, with the most recent payout of $0.10 per share scheduled for June 16, 2025. This follows previous quarterly distributions of the same amount in March, December, and September 2024, demonstrating consistency in its dividend strategy. Barrick has also engaged in share repurchases, reinforcing its commitment to shareholder value.
Over the past five years, Barrick Gold’s dividend growth rate has averaged 7.39% per year. While this growth rate is moderate compared to some high-yield dividend stocks, it reflects Barrick’s strategic approach to balancing payouts with operational investments. Investors should consider this steady growth when evaluating Barrick’s long-term dividend sustainability.
5. How Barrick Gold Compares to Other Dividend-Paying Gold Stocks
Barrick Gold’s dividend yield of 2.12% positions it competitively among gold stocks, but how does it compare to other major players? Newmont Corporation (NYSE: NEM) offers a 1.97% yield, with an annual dividend of $1.00 per share, paid quarterly. While Newmont has historically maintained stable dividends, its payout ratio of 22.53% suggests a conservative approach to shareholder returns.
Franco-Nevada Corporation (NYSE: FNV) operates under a royalty model, providing a 0.92% dividend yield with an annual payout of $1.52 per share. While its yield is lower than Barrick’s, Franco-Nevada’s 52.97% payout ratio reflects its commitment to returning capital to investors while maintaining financial flexibility Dividend History, Dates & Yield - Stock Analysis](https://stockanalysis.com/stocks/fnv/dividend/).
Wheaton Precious Metals Corp. (NYSE: WPM) follows a streaming model, ensuring dividend sustainability through long-term agreements. The company recently increased its quarterly dividend to $0.165 per share, marking a 6.5% growth from 2024. Meanwhile, Agnico Eagle Mines Limited (NYSE: AEM) maintains a 1.5% dividend yield, balancing consistency with reinvestment. Compared to Barrick, Agnico Eagle’s dividend strategy emphasizes long-term stability, making it a strong contender for income-focused investors.
These links will take you directly to their latest financial reports, dividend policies, and shareholder updates. Let me know if you need any further refinements!
Risks Associated with Barrick Gold’s Dividends
Barrick Gold’s dividend payouts are heavily influenced by commodity price fluctuations. Gold prices have historically been volatile, driven by macroeconomic factors such as inflation, interest rates, and geopolitical uncertainty. In 2025, gold prices peaked at $3,500 per ounce before retreating due to easing U.S.-China tariffs. This volatility can impact Barrick’s revenue, potentially leading to dividend reductions during downturns.
Operational risks also play a significant role in Barrick’s dividend sustainability. The company’s profitability depends on efficient mining operations, cost management, and production stability. While Barrick has maintained strong cash flow and a 30.08% dividend payout ratio, unexpected disruptions—such as equipment failures or labor disputes—could strain financial performance and affect dividend consistency.
Geopolitical risks further complicate Barrick’s dividend outlook. The company operates mines in politically unstable regions, including Mali, where government disputes have led to gold export blockades and workforce layoffs. Such conflicts can disrupt production, reduce revenue, and ultimately impact dividend payouts. Investors should monitor Barrick’s exposure to geopolitical risks when assessing dividend reliability.
Opportunities for Dividend Investors
Evaluating Barrick Gold’s dividend strength requires analyzing key financial metrics. Investors should consider the dividend payout ratio (30.08%), historical dividend growth (7.39% annually), and free cash flow trends. A sustainable payout ratio ensures dividends remain stable while allowing for reinvestment in growth initiatives.
Strategic investing in dividend-paying gold stocks involves diversification and timing. Investors can balance their portfolios by including royalty companies like Franco-Nevada (NYSE: FNV), which offer consistent dividends with lower operational risks. Additionally, monitoring gold price cycles can help investors capitalize on dividend increases during bullish markets.
Long-term vs. short-term dividend investors should weigh different considerations. Long-term investors benefit from compounding returns and dividend reinvestment, making Barrick’s steady payout attractive. Short-term investors, on the other hand, may seek higher-yield gold stocks or trade based on gold price movements. Understanding these dynamics helps investors align their strategies with financial goals.
Conclusion
Barrick Gold’s dividend strategy is more than just numbers—it's a balancing act between stability, market trends, and long-term sustainability. As we've seen, it’s competitive within the gold sector, but it’s not without risks. Price fluctuations, geopolitical uncertainties, and operational challenges are all factors investors need to weigh. Still, for those focused on dividend growth and compounding returns, Barrick offers a solid foundation.
The real takeaway? Investing in gold dividends isn’t just about chasing yield—it's about understanding the why behind the payouts. Whether you're optimizing a long-term portfolio or looking for strategic entry points, knowing how companies like Barrick compare to competitors can be a game-changer. Keep an eye on payout ratios, market conditions, and reinvestment strategies, and you’ll be positioning yourself for smarter investment decisions.
Material Stocks Quick Find List 🚀
Discover more about the material sector with our collection of in depth market exploration and and hot investment topics.
General 🌟
Construction Stocks 🏗️
Lumber Stocks 🌲
International Material Stocks 🌍
Metal Stocks ⚙️
Aluminum Stocks ✨
Steel Stocks 💪
Precious Metal Stocks 💎
Material Stocks with Dividends 🎯
Industrial Gas Stocks 🚀
Rare Earth Stocks 🌐
Advanced Materials 🔬