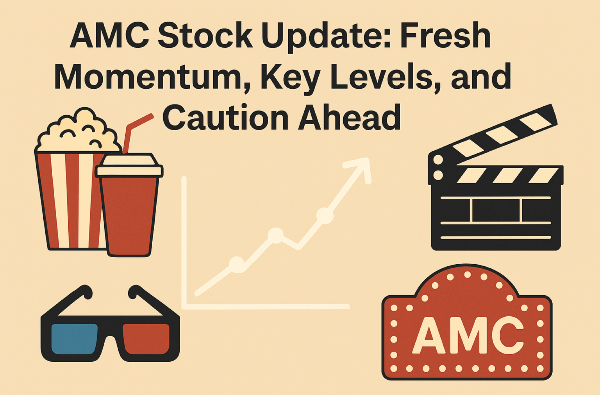
The price behavior of AMC Entertainment Holdings Inc. (NYSE: AMC) is signaling fresh momentum. While the stock has begun moving higher, traders must be mindful of several factors, especially considering AMC’s notorious volatility. It’s not a stock that offers sustainable or predictable moves, so caution remains essential—even in periods of upward swings.
Key Support and Resistance Levels
AMC’s current trading position is above $2.9, a critical support level. If the price remains above this mark, near-term upside targets become active, with immediate resistance levels at $5.6 and $6.2.
However, traders need to set $2.4 as a stop loss. If AMC falls below both $2.9 and $2.4, the downside pressure is likely to resume, signaling a potential reversal back to lower price territories. Given AMC’s history of sharp price swings, protecting against sudden declines should be a priority for risk management.
If AMC surpasses $6.2 and sustains momentum above this level, an extended rally may unfold, pushing the stock toward $11.5 and even $11.98. However, this scenario depends on how the stock behaves in response to broader market conditions and investor sentiment.
The Nature of AMC's Volatility
Investors and traders familiar with AMC understand that dramatic price movements are part of its identity. Even when the stock moves higher, sustainability remains uncertain. AMC has frequently displayed rapid surges followed by sharp pullbacks, making it imperative for traders to remain disciplined.
Short-term traders may capitalize on quick swings, but those looking for longer-term stability should approach AMC with caution. The stock is driven heavily by momentum trading, social media hype, and macroeconomic influences, meaning technical signals can change rapidly.
Trading Strategy Considerations
Navigating AMC requires a structured approach. Here are key elements to consider:
- Setting Stop Losses: Given the volatility, defining clear exit points—such as the $2.4 level—is crucial to managing risk.
- Monitoring Resistance Breakouts: If AMC pushes past $6.2 with sustained volume, traders should evaluate the likelihood of continued strength toward $11.5 or beyond.
- Disciplined Execution: Jumping into a trade without a clear plan can lead to unnecessary risk exposure. AMC’s unpredictable behavior requires precision.
Traders who follow these guidelines can better position themselves in the evolving AMC price action. While the stock’s latest movement suggests momentum, sustainability remains a question, reinforcing the importance of a disciplined trading strategy.
Stocks Similar to AMC
| Company Name |
Stock Symbol |
Why It's a Strong Alternative to AMC |
| Cinemark Holdings |
CNK |
Cinemark has a stronger balance sheet and better profitability, making it a more stable investment in the movie theater industry. |
| IMAX Corporation |
IMAX |
IMAX benefits from premium large-format screenings, driving higher margins and revenue per customer compared to AMC. |
| Marcus Corporation |
MCS |
Marcus Corporation operates both theaters and hotels, providing diversified revenue streams that reduce risk. |
| National CineMedia |
NCMI |
National CineMedia focuses on in-theater advertising, offering a unique revenue model that is less dependent on box office performance. |
| AMC Networks |
AMCX |
AMC Networks is a media company with streaming and cable assets, making it a more diversified entertainment investment than AMC Entertainment. |
https://youtu.be/VvbiwK96a64?si=06ZOT9HgUcU1Y1oG


The price behavior of AMC Entertainment Holdings Inc. (NYSE: AMC) is signaling fresh momentum. While the stock has begun moving higher, traders must be mindful of several factors, especially considering AMC’s notorious volatility. It’s not a stock that offers sustainable or predictable moves, so caution remains essential—even in periods of upward swings.
Key Support and Resistance Levels
AMC’s current trading position is above $2.9, a critical support level. If the price remains above this mark, near-term upside targets become active, with immediate resistance levels at $5.6 and $6.2.
However, traders need to set $2.4 as a stop loss. If AMC falls below both $2.9 and $2.4, the downside pressure is likely to resume, signaling a potential reversal back to lower price territories. Given AMC’s history of sharp price swings, protecting against sudden declines should be a priority for risk management.
If AMC surpasses $6.2 and sustains momentum above this level, an extended rally may unfold, pushing the stock toward $11.5 and even $11.98. However, this scenario depends on how the stock behaves in response to broader market conditions and investor sentiment.
The Nature of AMC's Volatility
Investors and traders familiar with AMC understand that dramatic price movements are part of its identity. Even when the stock moves higher, sustainability remains uncertain. AMC has frequently displayed rapid surges followed by sharp pullbacks, making it imperative for traders to remain disciplined.
Short-term traders may capitalize on quick swings, but those looking for longer-term stability should approach AMC with caution. The stock is driven heavily by momentum trading, social media hype, and macroeconomic influences, meaning technical signals can change rapidly.
Trading Strategy Considerations
Navigating AMC requires a structured approach. Here are key elements to consider:
Traders who follow these guidelines can better position themselves in the evolving AMC price action. While the stock’s latest movement suggests momentum, sustainability remains a question, reinforcing the importance of a disciplined trading strategy.
Stocks Similar to AMC
https://youtu.be/VvbiwK96a64?si=06ZOT9HgUcU1Y1oG