Why Do Most Automakers Struggle to Keep EV Margins High?
EV production costs remain high due to batteries, semiconductors, and logistics. Legacy automakers retrofit old plants, while newer brands design EV‑specific factories.
Profitability depends on three pillars: battery cost, software revenue, and manufacturing efficiency. Companies that control these pillars outperform peers.
Margin Driver Legacy OEMs Integrated EV Leaders
Battery sourcing Outsourced In‑house production
Software revenue Limited Subscription‑based
Factory design Retrofitted Purpose‑built EV plants
Why Does Tesla Still Set the Benchmark for EV Profitability?
Tesla remains the most profitable pure EV manufacturer. Its gross margin hovers around 18%, supported by software and energy sales.
Operating margins fell to 5.8% in late 2025 due to price cuts, but analysts expect recovery through cost reductions and Full Self‑Driving subscriptions.
Tesla’s vertical integration — batteries, software, and charging — keeps it ahead of rivals.
One unique detail: Tesla’s software revenue could exceed $2 billion annually if FSD adoption continues.
Why Is BYD Closing the Gap Through Scale and Integration?
BYD’s profit margins are lower than Tesla’s but rising fast. Its net margin sits near 4.8%, with strong growth from battery and semiconductor divisions.
BYD’s Blade Battery and in‑house chip production reduce costs.
Its mass‑market focus drives volume, offsetting thinner margins.
Automaker Net Margin Key Advantage
Tesla 15–18% gross Software + vertical integration
BYD 4.8% net Scale + cost control
Hyundai 6.25% net Efficient global production
BYD’s ability to profit from affordable EVs makes it unique among high‑volume manufacturers.
Why Do Hyundai and Kia Maintain Steady Margins?
Hyundai’s 6.25% net margin and Kia’s 7.8% reflect disciplined cost management.
Their shared E‑GMP platform reduces development costs.
Hyundai’s focus on mid‑range EVs balances affordability and profitability.
Both brands benefit from strong exports and battery partnerships with LG Energy Solution.
Why Are BMW and Mercedes Still Competitive Despite Transition Costs?
BMW’s 4.9% net margin and Mercedes‑Benz’s 5.3% show resilience during electrification.
Luxury pricing offsets high R&D spending.
Both companies leverage premium EVs like the i7 and EQS to maintain profitability.
Automaker Net Margin Strategy
BMW 4.9% Premium EVs + efficiency
Mercedes‑Benz 5.3% Luxury pricing + brand strength
Toyota 9.3% Hybrid leadership + scale
Toyota’s hybrid dominance keeps its margins higher than most pure EV makers.
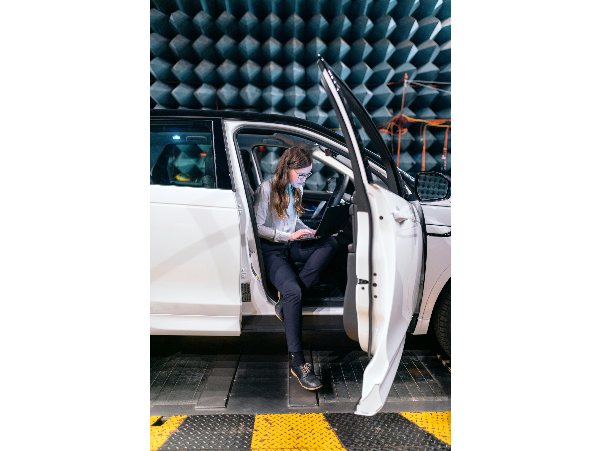
Why Do Software and Energy Businesses Matter More Than Cars?
Software and energy storage now drive EV profitability.
Tesla’s energy division deployed 8.8 GWh in Q1 2026, adding high‑margin revenue streams.
BYD sells stationary batteries and solar systems.
Hyundai invests in vehicle‑to‑grid technology.
These businesses stabilize margins when car prices fluctuate.
Why Does the Real Answer to “Who Has the Best Profit Margins?” Depend on Integration?
Profitability depends on integration, not just sales.
Tesla leads through software and energy.
BYD follows with vertical manufacturing.
Hyundai and Kia sustain margins through shared platforms.
Luxury brands maintain profitability through pricing power.
Rank Automaker Net Margin (2026 est.) Core Strength
1 Tesla ≈ 15–18% gross Software + energy ecosystem
2 Toyota ≈ 9.3% Hybrid scale efficiency
3 Hyundai / Kia ≈ 6–7.8% Platform cost control
4 Mercedes / BMW ≈ 5% Luxury pricing
5 BYD ≈ 4.8% Vertical integration + volume
The solution to the problem introduced at the start is not to chase sales growth. It is to understand which automakers combine technology, scale, and diversification. Those with the best profit margins — Tesla, Toyota, Hyundai, Kia, Mercedes, BMW, and BYD — define the financial future of electric mobility.
| Rank |
Automaker |
Gross / Net Margin |
Core Strength |
Key Notes |
| 1 |
Tesla |
15–18% gross |
Software + energy ecosystem |
FSD and energy storage boost margins |
| 2 |
Toyota |
9.3% net |
Hybrid scale efficiency |
Strong hybrid sales stabilize profits |
| 3 |
Hyundai / Kia |
6–7.8% net |
Platform cost control |
Shared E‑GMP platform reduces costs |
| 4 |
Mercedes / BMW |
≈5% net |
Luxury pricing |
Premium EVs offset R&D expenses |
| 5 |
BYD |
4.8% net |
Vertical integration + volume |
Blade Battery and in‑house chips |
| — |
Volkswagen |
≈4.5% net |
European scale |
Transitioning to EV profitability |
| — |
Rivian |
≈3% net |
Niche pickup segment |
Scaling toward break‑even |


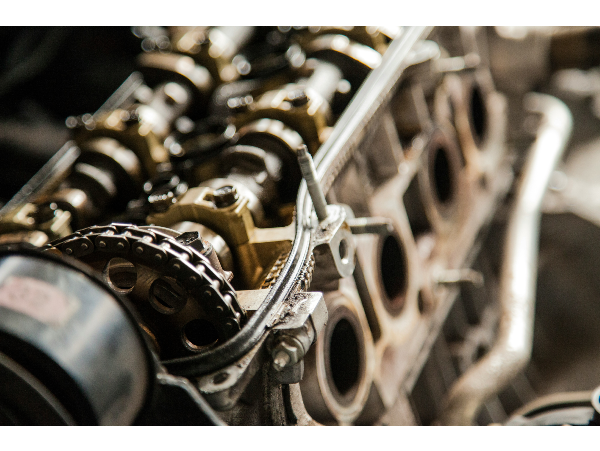


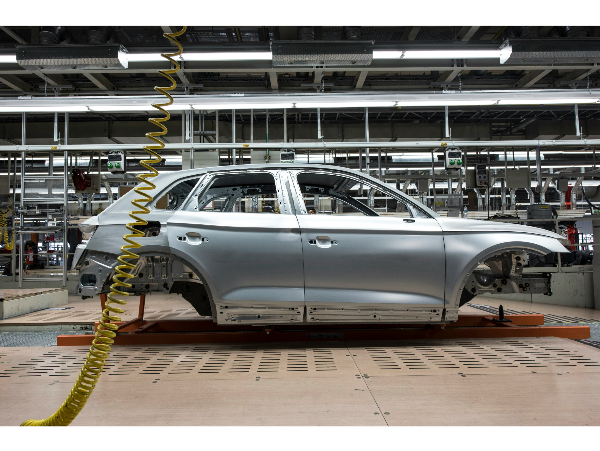
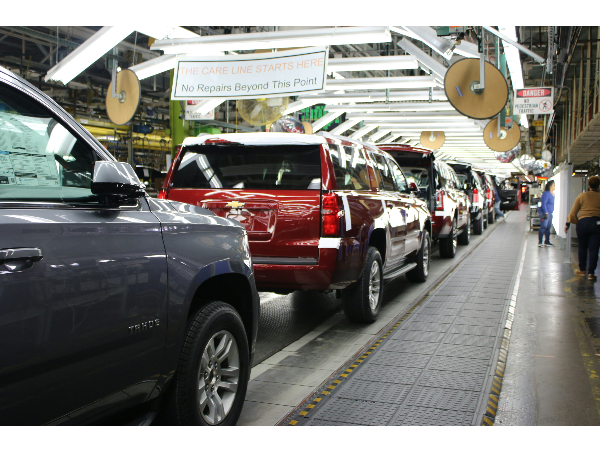


Why Do Most Automakers Struggle to Keep EV Margins High? EV production costs remain high due to batteries, semiconductors, and logistics. Legacy automakers retrofit old plants, while newer brands design EV‑specific factories. Profitability depends on three pillars: battery cost, software revenue, and manufacturing efficiency. Companies that control these pillars outperform peers.
Margin Driver Legacy OEMs Integrated EV Leaders Battery sourcing Outsourced In‑house production Software revenue Limited Subscription‑based Factory design Retrofitted Purpose‑built EV plants
Why Does Tesla Still Set the Benchmark for EV Profitability? Tesla remains the most profitable pure EV manufacturer. Its gross margin hovers around 18%, supported by software and energy sales. Operating margins fell to 5.8% in late 2025 due to price cuts, but analysts expect recovery through cost reductions and Full Self‑Driving subscriptions. Tesla’s vertical integration — batteries, software, and charging — keeps it ahead of rivals.
One unique detail: Tesla’s software revenue could exceed $2 billion annually if FSD adoption continues.
Why Is BYD Closing the Gap Through Scale and Integration? BYD’s profit margins are lower than Tesla’s but rising fast. Its net margin sits near 4.8%, with strong growth from battery and semiconductor divisions. BYD’s Blade Battery and in‑house chip production reduce costs. Its mass‑market focus drives volume, offsetting thinner margins.
Automaker Net Margin Key Advantage Tesla 15–18% gross Software + vertical integration BYD 4.8% net Scale + cost control Hyundai 6.25% net Efficient global production
BYD’s ability to profit from affordable EVs makes it unique among high‑volume manufacturers.
Why Do Hyundai and Kia Maintain Steady Margins? Hyundai’s 6.25% net margin and Kia’s 7.8% reflect disciplined cost management. Their shared E‑GMP platform reduces development costs. Hyundai’s focus on mid‑range EVs balances affordability and profitability.
Both brands benefit from strong exports and battery partnerships with LG Energy Solution.
Why Are BMW and Mercedes Still Competitive Despite Transition Costs? BMW’s 4.9% net margin and Mercedes‑Benz’s 5.3% show resilience during electrification. Luxury pricing offsets high R&D spending. Both companies leverage premium EVs like the i7 and EQS to maintain profitability.
Automaker Net Margin Strategy BMW 4.9% Premium EVs + efficiency Mercedes‑Benz 5.3% Luxury pricing + brand strength Toyota 9.3% Hybrid leadership + scale
Toyota’s hybrid dominance keeps its margins higher than most pure EV makers.
Why Do Software and Energy Businesses Matter More Than Cars? Software and energy storage now drive EV profitability. Tesla’s energy division deployed 8.8 GWh in Q1 2026, adding high‑margin revenue streams. BYD sells stationary batteries and solar systems. Hyundai invests in vehicle‑to‑grid technology.
These businesses stabilize margins when car prices fluctuate.
Why Does the Real Answer to “Who Has the Best Profit Margins?” Depend on Integration? Profitability depends on integration, not just sales. Tesla leads through software and energy. BYD follows with vertical manufacturing. Hyundai and Kia sustain margins through shared platforms. Luxury brands maintain profitability through pricing power.
Rank Automaker Net Margin (2026 est.) Core Strength 1 Tesla ≈ 15–18% gross Software + energy ecosystem 2 Toyota ≈ 9.3% Hybrid scale efficiency 3 Hyundai / Kia ≈ 6–7.8% Platform cost control 4 Mercedes / BMW ≈ 5% Luxury pricing 5 BYD ≈ 4.8% Vertical integration + volume
The solution to the problem introduced at the start is not to chase sales growth. It is to understand which automakers combine technology, scale, and diversification. Those with the best profit margins — Tesla, Toyota, Hyundai, Kia, Mercedes, BMW, and BYD — define the financial future of electric mobility.